
Housing — for housing associations and councils
Find the problem before the tenant reports it
Damp and mould, component failure and repairs demand are all predictable from data most landlords already hold, whether the landlord is a housing association or a council. These models score every property in the stock, return the reasons behind each score, and turn a reactive service into a planned one. For housing options teams, the same approach sizes temporary accommodation demand and cost.
Damp and mould risk model
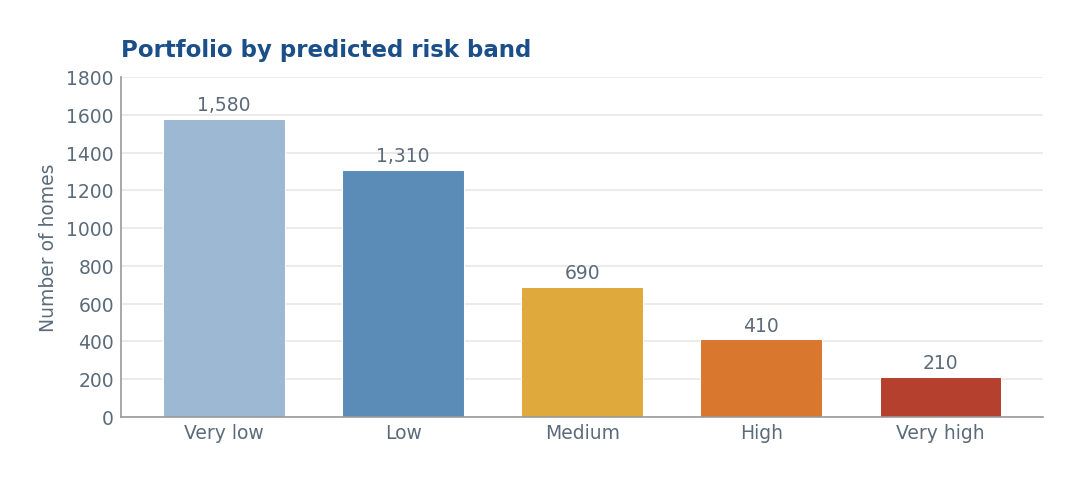
Every home in the portfolio receives a risk score from 0 to 1 for the likelihood of developing damp or mould, built from property attributes, repairs history, stock‑condition survey data and energy performance.
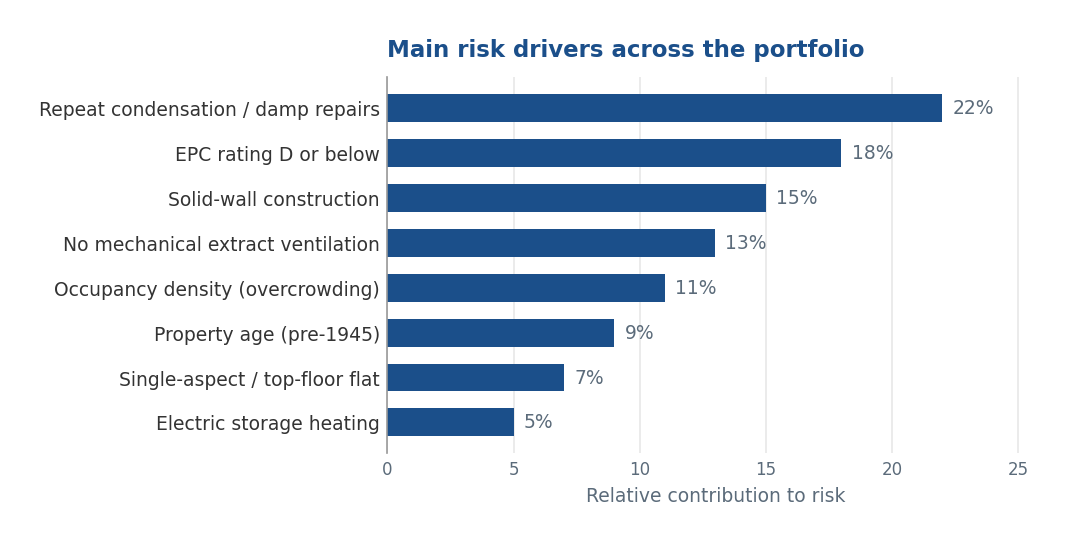
Critically, the model returns the main factors behind each score, not just the score. That is what turns a number into an inspection list and an investment case — a home flagged for repeat condensation repairs needs a different response to one flagged for solid‑wall construction and an EPC of E.
- Property‑level risk scores across the whole stock, banded very low to very high
- A priority inspection list, sized to what the team can actually visit
- Primary driver and a suggested action for each flagged property
- Portfolio‑level driver analysis to direct ventilation, insulation and heating programmes
- Scores recalibrated as new repairs and survey data accrue
Evidence for Awaab's Law and the consumer standards
Statutory timescales for investigating and remedying damp and mould reward landlords who know where the risk sits before a report arrives. A scored, driver‑attributed stock list is defensible evidence of a proactive approach — for the Regulator of Social Housing, for the Housing Ombudsman, and for board or member assurance. The same duties apply to councils with their own housing stock as to housing associations.
- A documented, data‑driven basis for prioritising inspections
- An audit trail showing why each property was prioritised
- Investment programmes justified by predicted risk rather than stock age alone
Predictive repairs and asset investment
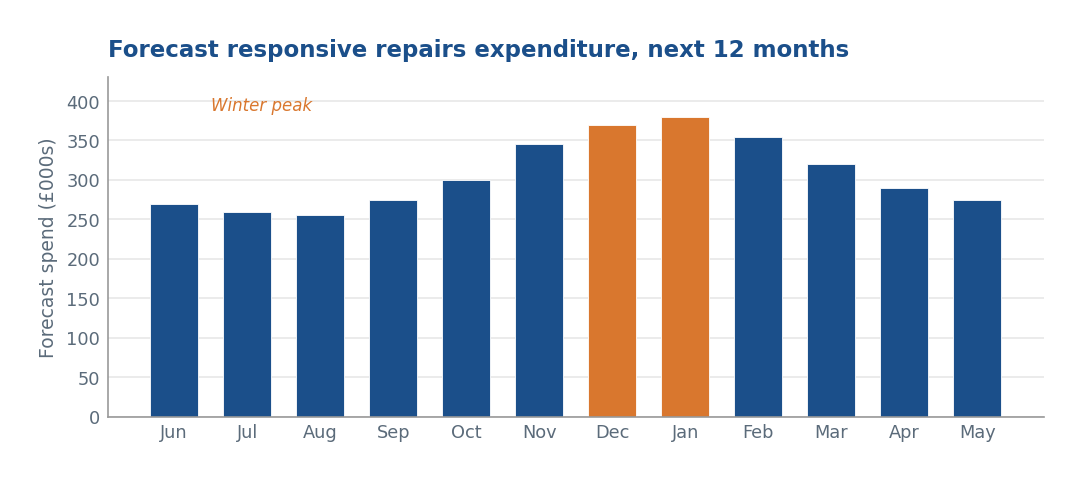
Two forecasts in one model. At portfolio level, it projects responsive repairs demand and expenditure month by month across the coming year — including the winter peak driven by heating and weather‑related failures. At component level, it predicts which components are most likely to fail and when.
Setting the budget against a forecast profile, rather than a flat twelfth of last year's outturn, improves cash planning and reduces year‑end surprises.
- Monthly forecast of responsive repairs spend for the next twelve months
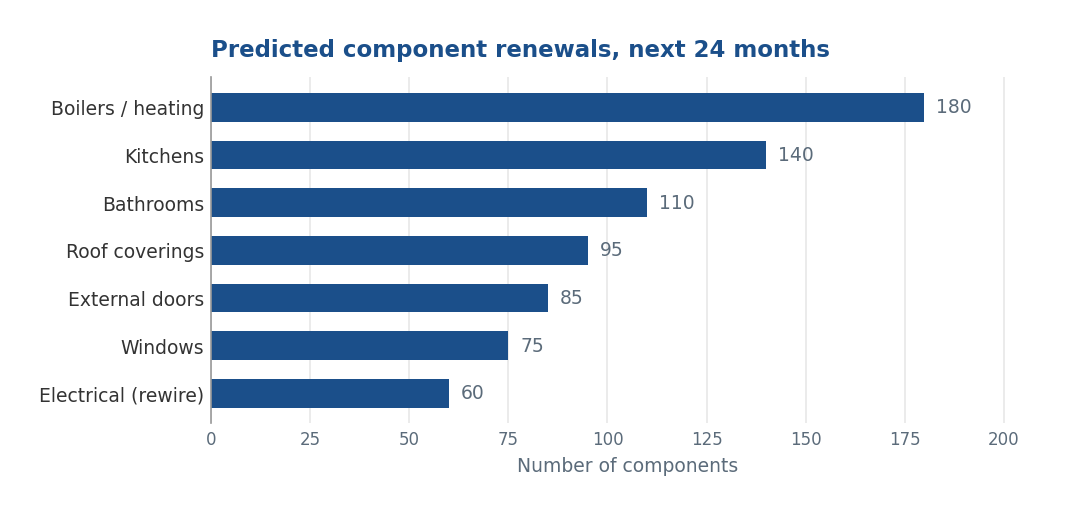
- Predicted failure window and estimated cost for each component
- Components flagged for early renewal, with a suggested action
- Components that can safely be deferred beyond scheduled renewal, releasing budget
- Built from the asset register, stock‑condition surveys, repairs history and the planned maintenance programme
Planned investment that follows likelihood, not the lifecycle table
Standard component lifecycles renew things that are still serviceable and miss things that are not. Predicting failure at component level lets the planned programme follow actual condition and risk — bringing forward what is about to fail, deferring what is not, and releasing the difference to the homes that need it sooner.
- A ranked renewal programme, costed and sequenced
- Deferrals identified explicitly, with the evidence behind them
- A defensible thirty‑year asset plan built from stock‑level prediction
Temporary accommodation and homelessness
Why the caseload is growing, not just how fast
Temporary accommodation is one of the fastest‑growing pressures on council budgets, and the headline caseload hides the cause.
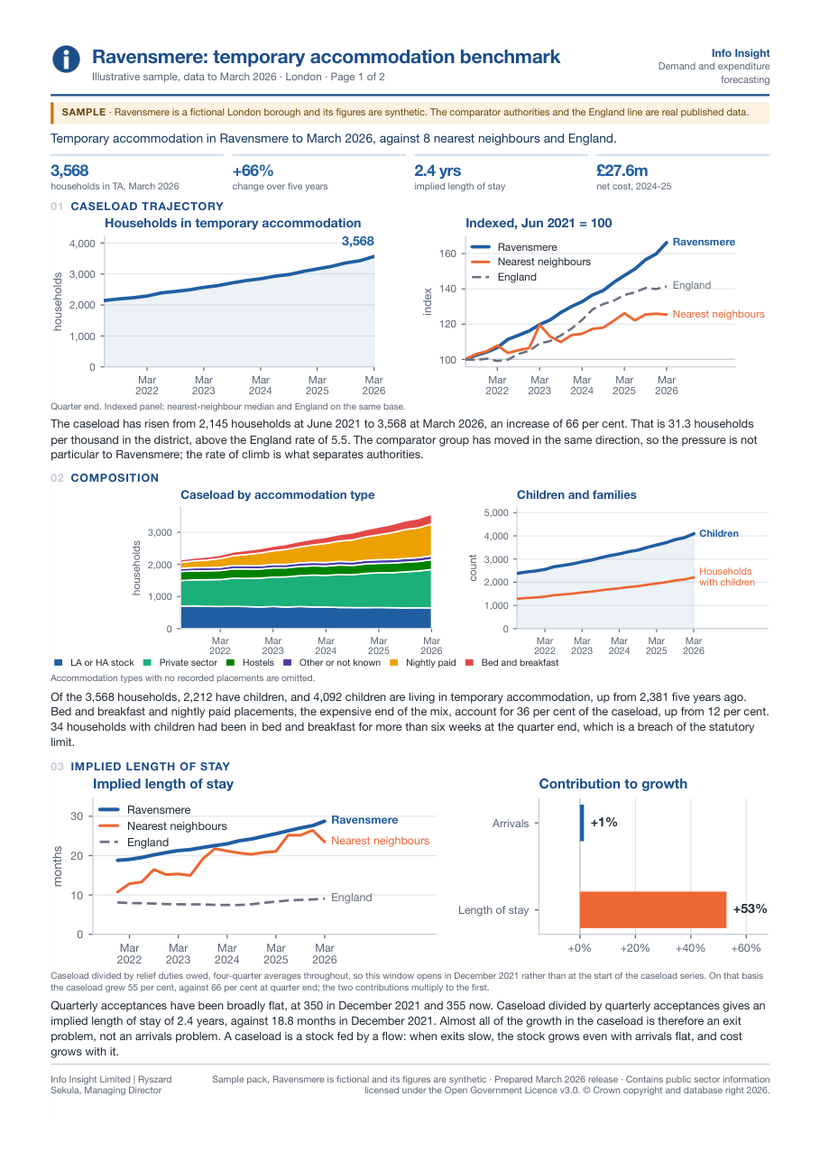
Temporary accommodation demand, cost and benchmarking
Caseload, cost and length‑of‑stay modelling for temporary accommodation, benchmarked against nearest statistical neighbours and England, with the growth decomposed into arrivals and exits.
The decomposition matters: a caseload is a stock fed by a flow, and a rising stock driven by slowing exits calls for a very different response than one driven by rising arrivals. In the sample benchmark, arrivals contributed +1% of growth and length of stay +53%.
- Caseload trajectory and composition by accommodation type
- Implied length of stay against comparator authorities
- Contribution of arrivals versus length of stay to growth
- Net cost projection and nightly‑paid exposure
Also available
The same methods, applied to housing operations
The same methods apply wherever demand, cost and risk are driven by large numbers of individual cases or properties.
Expenditure and demand forecasting
Machine learning on existing activity combined with stochastic simulation of new demand, producing twelve‑month and multi‑year expenditure forecasts with the assumptions exposed for your team to flex.
AI‑driven performance reporting
Automated analysis of complex operational and financial data, returning a clear written narrative on risks, pressures and opportunities — ready for a board or committee paper.
Process and capacity simulation
Discrete‑event simulation of operational processes — repairs scheduling, void turnaround, contractor capacity — to locate bottlenecks and test changes before committing to them.
What we need from you for the stock models
Less than most people expect. The models are built from data landlords already hold for other reasons.
- Asset register — property attributes, construction type, age band, component installation dates
- Repairs history — ideally five or more years of jobs at property level, with trade and category
- Stock‑condition survey data — whatever coverage exists, including partial
- Energy performance — EPC ratings and, where held, heating and ventilation type
- Tenancy context — occupancy and, where appropriate, complaint or report history
Data is pseudonymised and stays inside your own environment throughout. Identifiers should be consistent across years so that longitudinal patterns are preserved.
Score your stock before the next winter, not after it
A damp and mould risk model or a repairs forecast can be built from data you already hold. Send us the shape of your asset and repairs extracts and we will tell you what is feasible.