
Social care
Models for the decisions that move the budget
Adult social care and children's placements are the two largest and least predictable lines in most upper‑tier budgets. Demand and cost are set by thousands of individual cases, and the budget is set once a year. These models forecast what those cases will do next, and test whether prevention pays back.
Adult social care
Expenditure, need and capacity
We model adult social care from the record level up, rather than uplifting last year's outturn.
ASC expenditure forecasting
Two complementary methods in one model. Machine learning is applied to pseudonymised, record‑level expenditure data to predict next year's cost for every client already active in the system. Stochastic simulation models the probable number and cost of new clients starting services during the year, drawing on historical patterns while letting your analysts adjust the underlying assumptions. The two are then combined into a single forecast with a confidence range.
Twelve‑month forecasts typically vary by less than one per cent from actuals. A separate long‑term model extends the horizon to five years and beyond for medium‑term financial planning.
- Total forecast expenditure, income and net cost, broken down by care group, service type and age band
- The likelihood of exceeding the allocated budget for each service line
- Client‑level views: who is likely to see the largest cost increase, and whose spending pattern is unusual
- Assumption inputs your finance and commissioning teams can change themselves
At a glance
- Forecast accuracy
- 0.6% total variance from actual spend in the latest county council deployment
- Client‑level fit
- R² 0.89 on hold‑out data, mean error about £4,900 per client
- Horizon
- 12 months operational, 5+ years for MTFP
- Methods
- Competed ML algorithms plus stochastic simulation of new starters
- You receive
- Model code, spreadsheets, methodology, retraining instructions and training
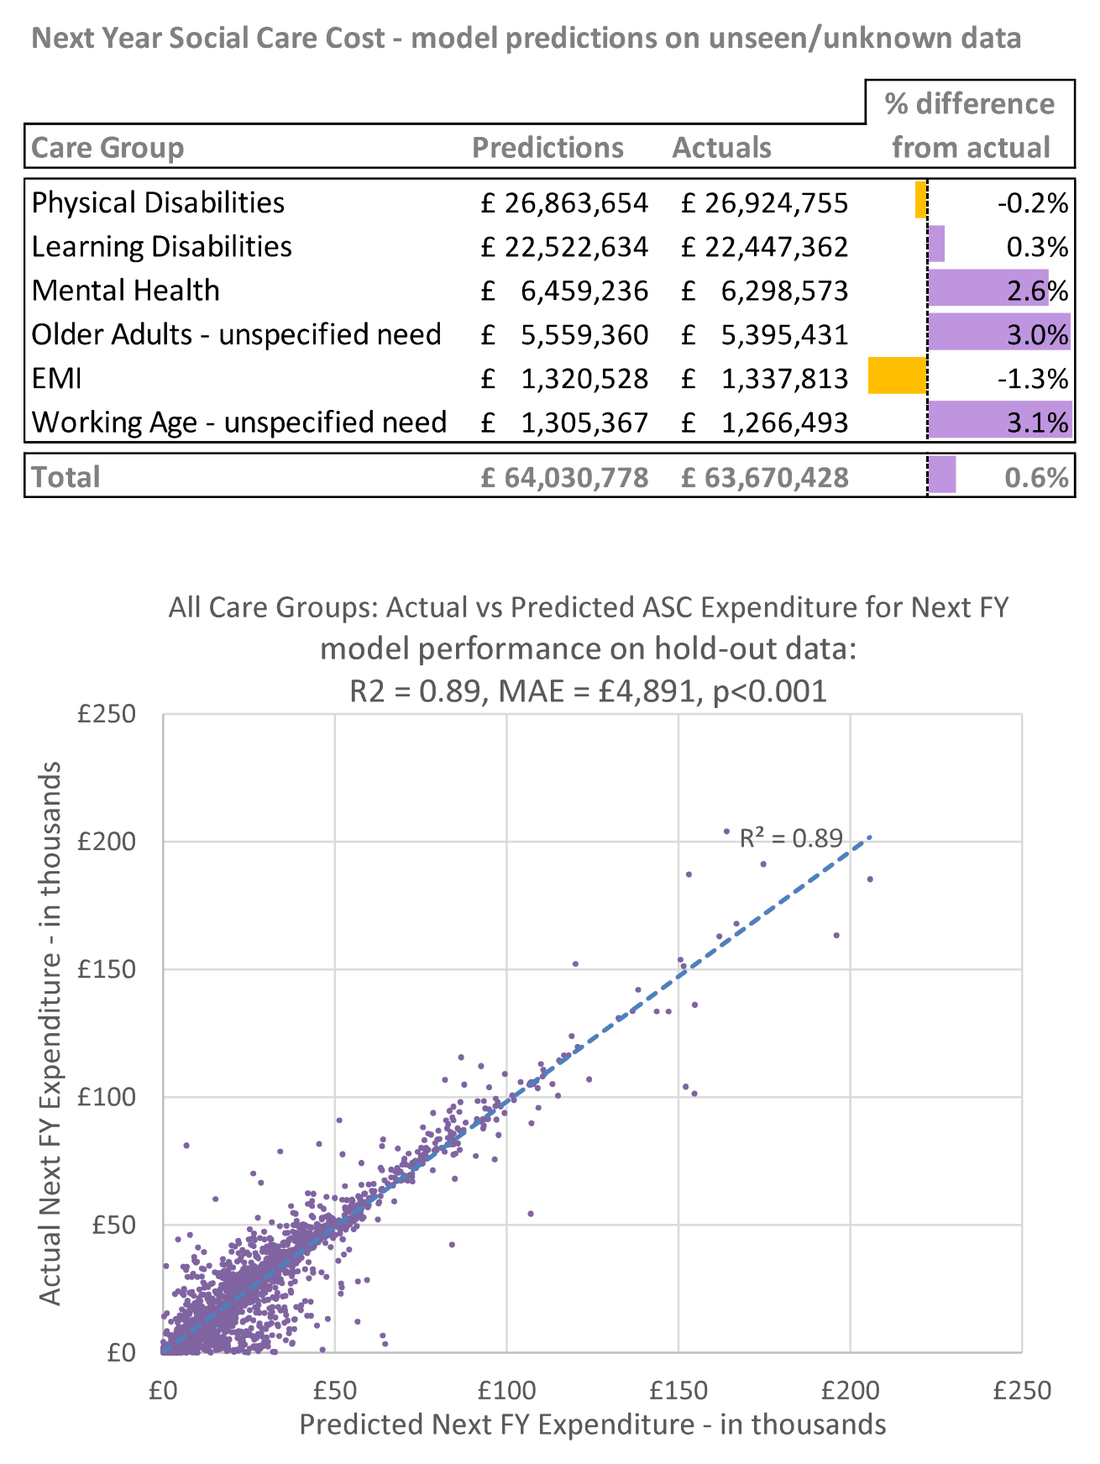
Tested on a year the model had not seen
Several algorithms are trained on 80% of the client records and competed on the remaining 20%, and the best performer is kept. The test that matters is the next financial year. In the most recent county council deployment the model predicted £64.0m against an actual £63.7m, 0.6% above the outturn.
The larger care groups came in closest: physical disabilities within 0.2% and learning disabilities within 0.3%. The smaller groups varied by up to 3.1%, and that is reported alongside the headline figure.
- Accuracy reported by care group, not only in total
- Client costs ranging from under £100 to over £200,000 a year, predicted in the same model
- Retrained each year so accuracy holds as the client base changes
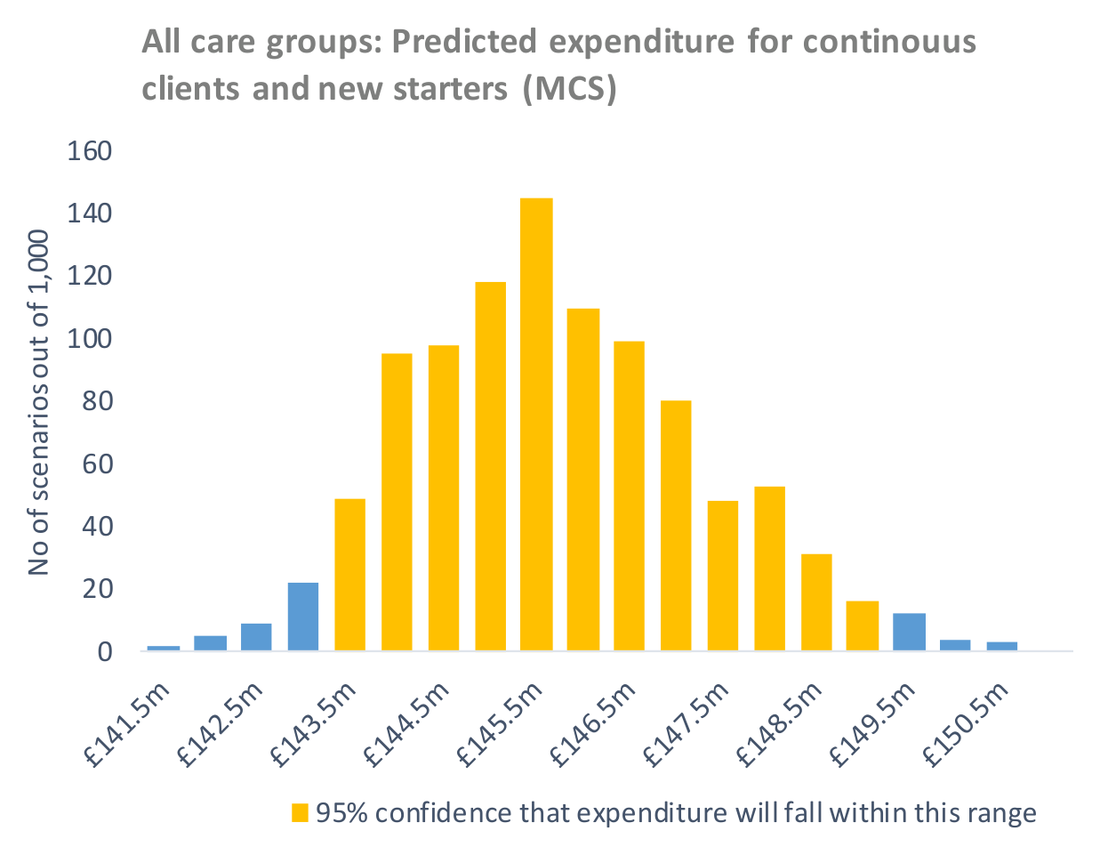
A range to set the budget against, not a single number
A single forecast figure hides the question finance teams actually face: how likely is an overspend? The simulation of new starters runs 1,000 times, each time drawing a different plausible number and mix of new clients, and each run is added to the machine learning prediction for existing clients. The result is a distribution of total spend for the year.
The yellow bars mark the range the forecast is 95% confident of. Set a budget at any point on that axis and the model gives the chance of exceeding it. The confidence level is itself an input your finance team can change.
- Forecast spend with a confidence range at the level you choose
- The probability of exceeding budget, by service line and care setting
- The forecast breakdown compared with previous years
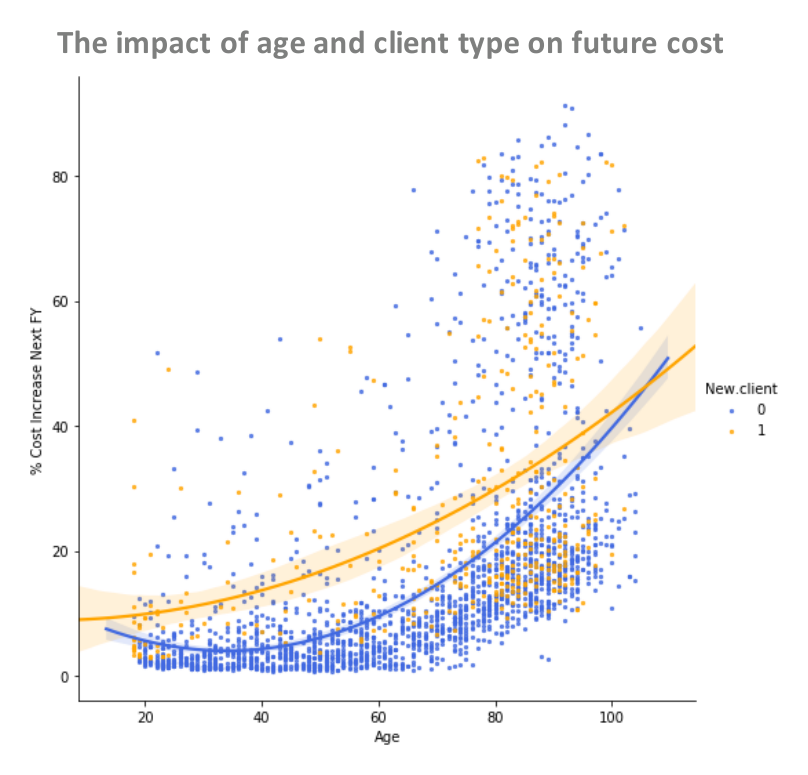
Why new clients are modelled separately
New and existing clients do not behave the same way. Across one client base, the expected rise in next year's cost for continuing clients stayed low through working age and climbed steeply from around 60. For new clients it was higher at almost every age, including younger adults.
A model that pooled the two would understate what new starters cost and blur the growth among older continuing clients. That is why the forecast combines machine learning for existing clients with simulation of the ones yet to arrive.
- Cost trajectories by age, care group and client type
- Clients whose cost is likely to rise most next year, flagged for review
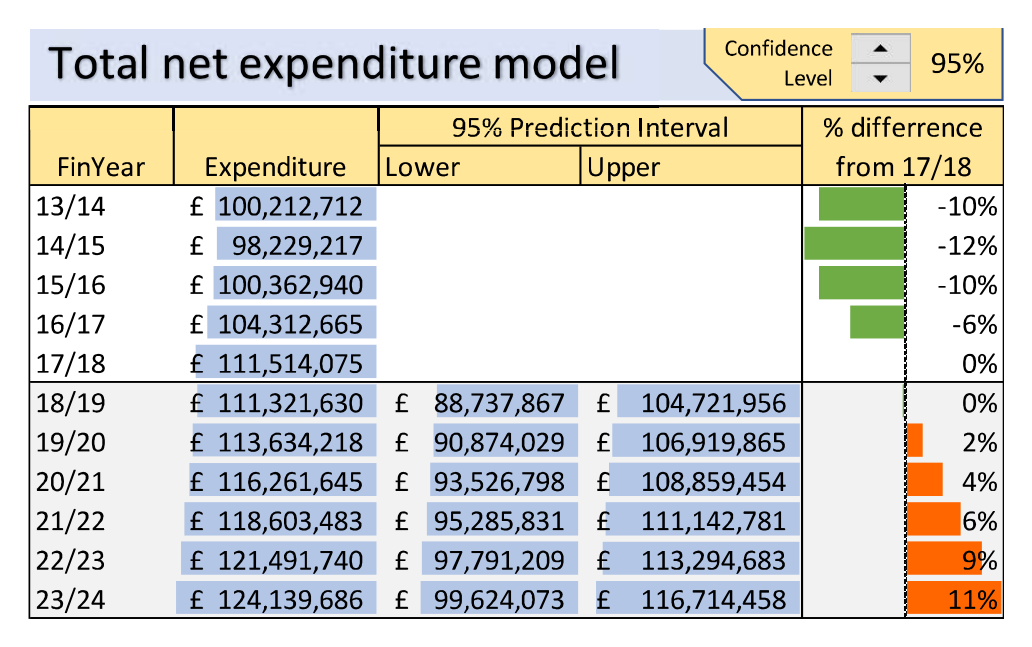
Five to ten years ahead, with the uncertainty stated
The long‑term model uses time‑series analysis of historical cost data to set the assumptions for expenditure and income simulations. It answers the questions a medium‑term financial plan actually asks: what spending will look like over the next five to ten years, which budget lines will move most, and how likely each is to breach its allocation in any given year.
- Service‑level forecasts, not only a single total
- Prediction intervals at a confidence level you choose
- Scenario runs for inflation, mortality and demand shocks
A forecast Finance can put in the MTFS
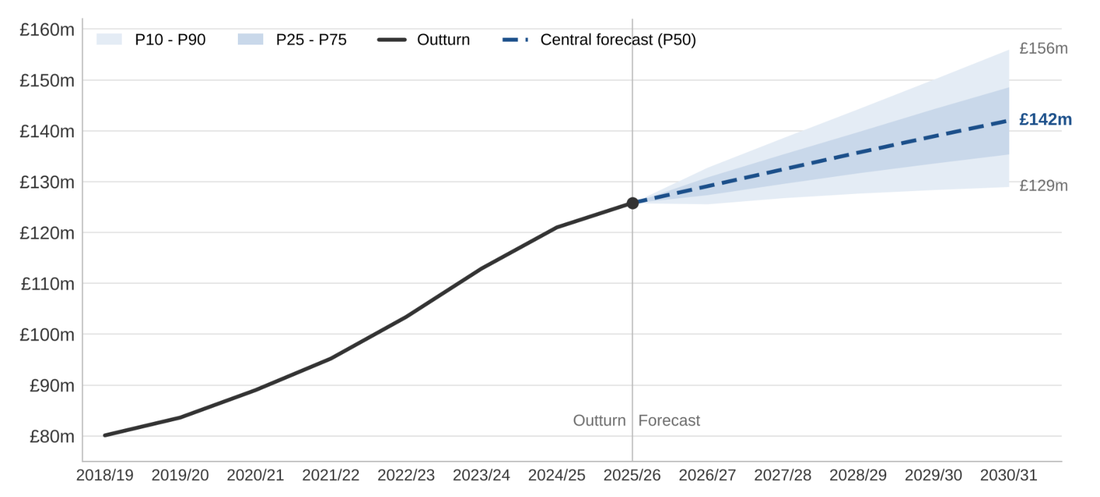
The medium‑term output is built for the financial strategy itself: spend and client numbers by care setting for five years, a range around every year, and the base year reconciled to the ledger so the starting point is not in dispute. Spend not held at client level, such as block contracts, is carried as explicit lines rather than lost.
In the sample, the central forecast reaches £142.0m by 2030/31, inside a range of £129m to £156m. By then 72% of spend is on people not yet in service, so the new‑starter and fee assumptions carry the forecast — and Finance owns them, in an editable assumptions register. A downside scenario adds £24.2m over five years and a stress case £50.8m.
- Central forecast and range by care setting, with client numbers
- Which assumptions matter most, and the £ effect of a 1% change in each
- Upside, downside, stress and policy scenarios defined by Finance
- Backtested against actual outturn, and rerun each year from a runbook
Long‑term care spend: more people, or a higher price?
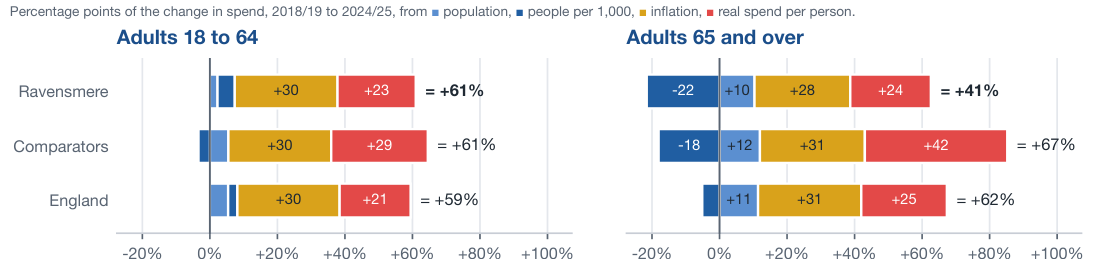
Most budgets uplift last year's outturn for demography and inflation. That is a forecast of volume, and across England most of the growth in long‑term care has come from price. Using published Adult Social Care Finance Return and activity data, the change in spend since 2018/19 is split into four parts — population, the share of people supported, inflation and real spend per person — for each age group, against ten nearest neighbours, England and every other council.
In the sample, spend rose by 51% while the number of people supported fell by 4%, and 2024/25 came in £14.1m above what demography and inflation predicted. For older people the uplift landed close, but only because a falling share supported cancelled out a rising real cost per person — close for the wrong reason, which does not last. Projected to 2030/31, the two paths sit £27m apart.
- Spend, people supported and spend per person indexed against inflation, by age group
- The change in spend decomposed into volume and price, against comparators and England
- Every council in England plotted, so the borough's position is read against the national pattern
- Two paths to 2030/31: demography only, and real spend per person at its recent pace
Predicting need for long‑term social care
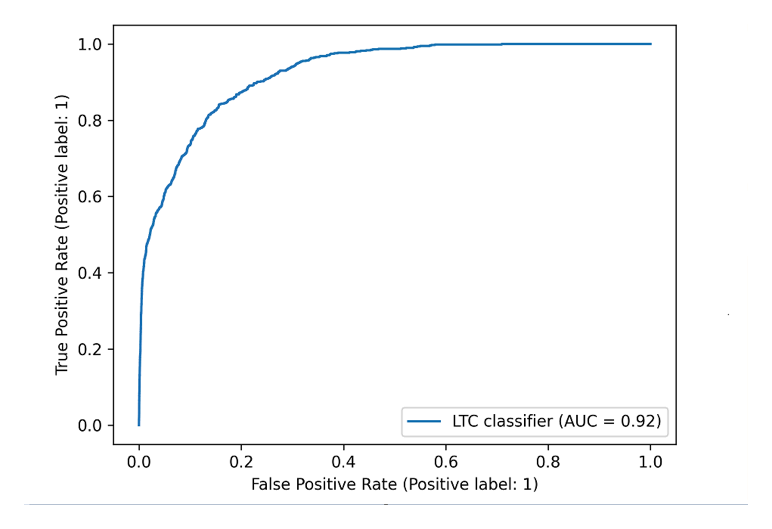
A supervised classifier that scores new and existing social care clients on the likelihood of needing long‑term care in the near future. On held‑out test data the model achieves an AUC of 0.92 and 84% accuracy, with sensitivity and specificity balanced at 54%.
The value is in what it enables upstream: identifying the cohort most likely to escalate, early enough for reablement, prevention or a different care pathway to change the outcome.
- Case‑level probability scores, refreshed as new activity is recorded
- The drivers behind each score, not just the score itself
- Cohort views for commissioning and prevention targeting
- Model performance reported openly, including where it is weak
Capacity, flow and resource optimisation
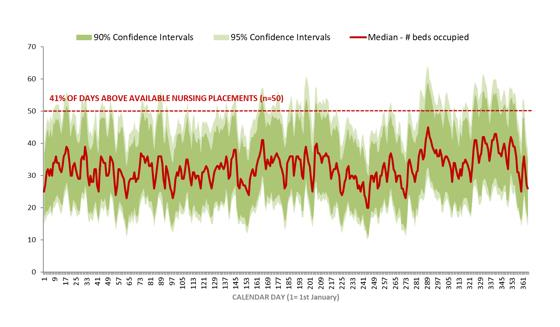
Discrete‑event simulation of the care system as it actually behaves — arrivals, placements, length of stay and discharge — to find where client flow is constrained and what it would take to relieve it.
Rather than a single point estimate, the output is a distribution: how often occupancy exceeds available placements, how much of the year sits above capacity, and what changing the quantity of a specific resource does to throughput.
- Impact of changes in resource quantity on client throughput
- Capacity models showing the resources needed to absorb activity growth
- Optimal allocation to minimise bottlenecks and improve utilisation
- Five‑year forward view with confidence intervals
Distributions, not averages
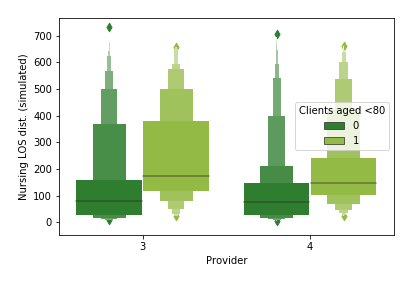
An average length of stay hides exactly the behaviour that causes a capacity problem. The simulation is driven by fitted distributions — per provider, per care group, per age band — so the long tail that fills the beds is represented rather than averaged away.
- Length of stay, arrival rates and cost fitted from your own historical records
- Provider and cohort variation preserved rather than pooled
- Assumptions exposed as inputs your analysts can change and rerun
Prevention and early intervention
Which prevention programmes actually pay back
Prevention budgets are usually defended with evidence from somewhere else. These models test each programme against your own client group and cost base, and say how likely the saving is, not only how big.
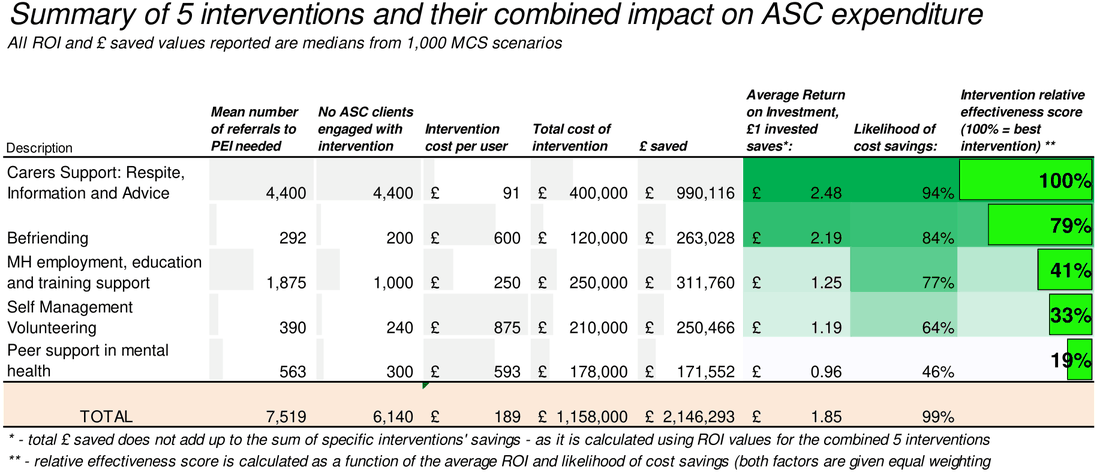
Return on investment and likelihood of cost savings
Each intervention is modelled against the adult social care clients it would realistically reach: programme cost and capacity, the share of users who drop out, and the plausible range of impact on their care costs. Monte Carlo simulation runs 1,000 scenarios across those ranges.
In one evaluation of five programmes, carers support returned £2.48 for every £1 with a 94% likelihood of saving money. Peer support in mental health returned £0.96 and was more likely to add cost than save it, driven by high dropout, a relatively high cost per user and a client group whose care costs were mostly low to begin with.
- Return per £1 invested, with confidence intervals
- Likelihood of cost saving for each programme
- Referral volumes needed to reach the modelled caseload
- A relative effectiveness score for ranking competing programmes
The programme as a whole, not just its parts
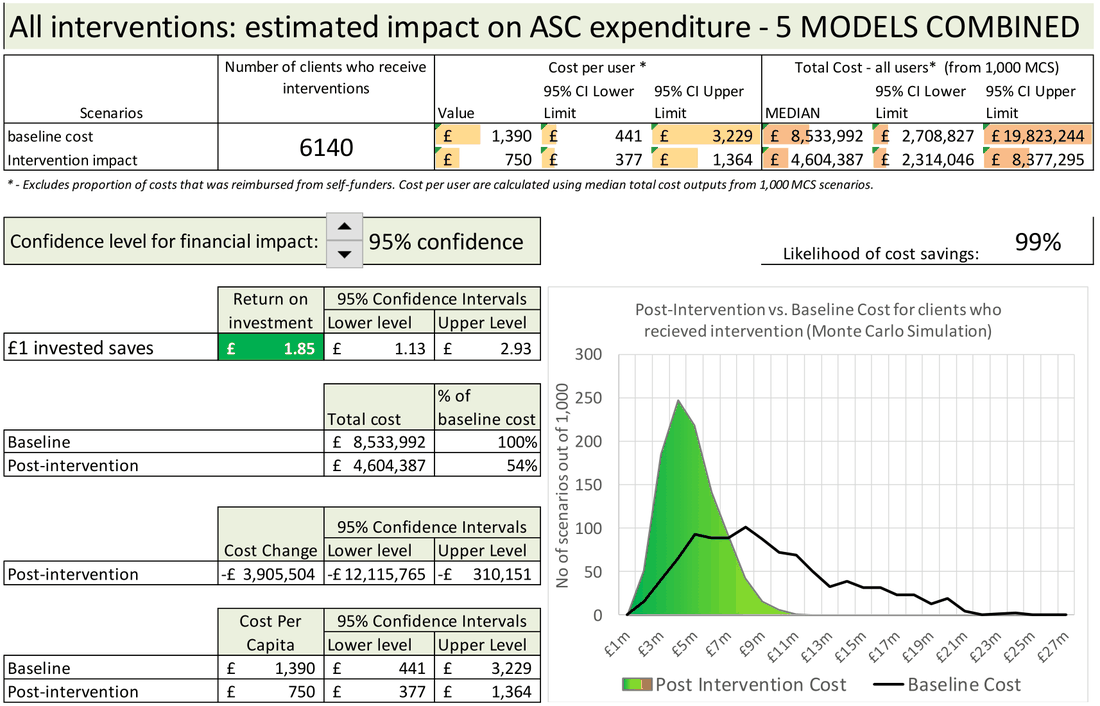
Weak programmes do not always sink a portfolio. Across all five interventions, reaching around 6,100 clients, the combined return was £1.85 per £1 (95% CI £1.13 to £2.93) with a 99% likelihood of saving money. Median cost per user fell from £1,390 to £750.
That changes the conversation from "does this pilot work?" to "which mix gives the most dependable saving for the budget we have?"
- Baseline cost drawn from your own client records, filtered to the eligible cohort
- Assumptions set out openly and editable, with local evidence noted against each
- Confidence level adjustable for the financial impact you report
Where the saving falls across NHS and council budgets, each budget can be valued separately: combined NHS and social care return on investment
Children's services
Placement demand and cost volatility
Placements are the largest and most volatile cost driver in children's services, and the hardest to explain after the fact. The model separates the two things that drive the overspend.
Looked‑after children placement modelling
Forecasts of placement numbers by type over one to five years, with total and average placement cost, and a clear split between volume risk and price and market risk — so a pressure can be attributed to more children entering care or to the market repricing the placements already commissioned.
Each placement is forecast from child and placement attributes, placement history, cost and contract data and demand trends, and the model returns the principal drivers behind each forecast rather than the number alone. Forecasts are recalibrated as new data accrues.
- Forecast numbers by placement type, one to five years ahead
- Total and average placement cost by type
- Identification of high‑cost and high‑volatility pressures
- Volume risk separated from price and market risk
At a glance
- Horizon
- 1 to 5 years, by placement type and at child level
- Built from
- Placements, finance and contract data, placement history and demand trends
- Decomposition
- Volume risk separated from price and market risk, year by year
- Also returned
- Primary driver and a suggested action for each high‑cost placement
- You receive
- Model code, spreadsheets, methodology, retraining instructions and training
A handful of placements sets the budget
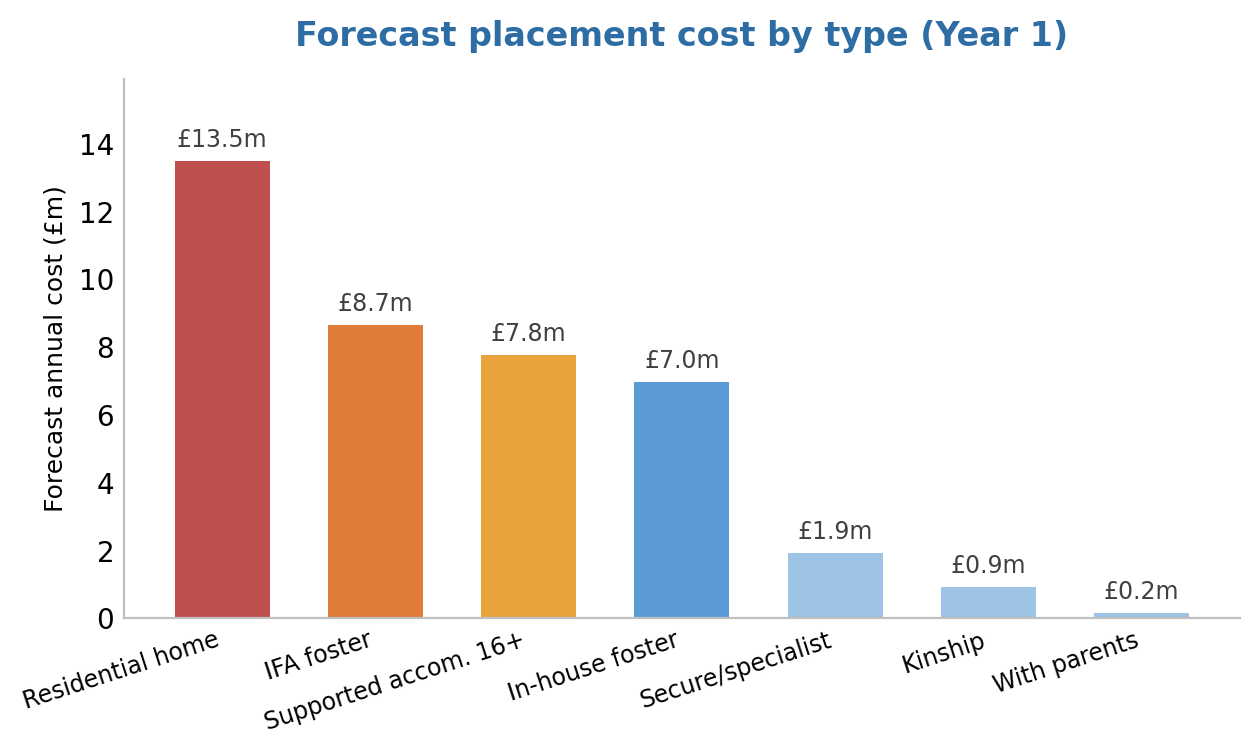
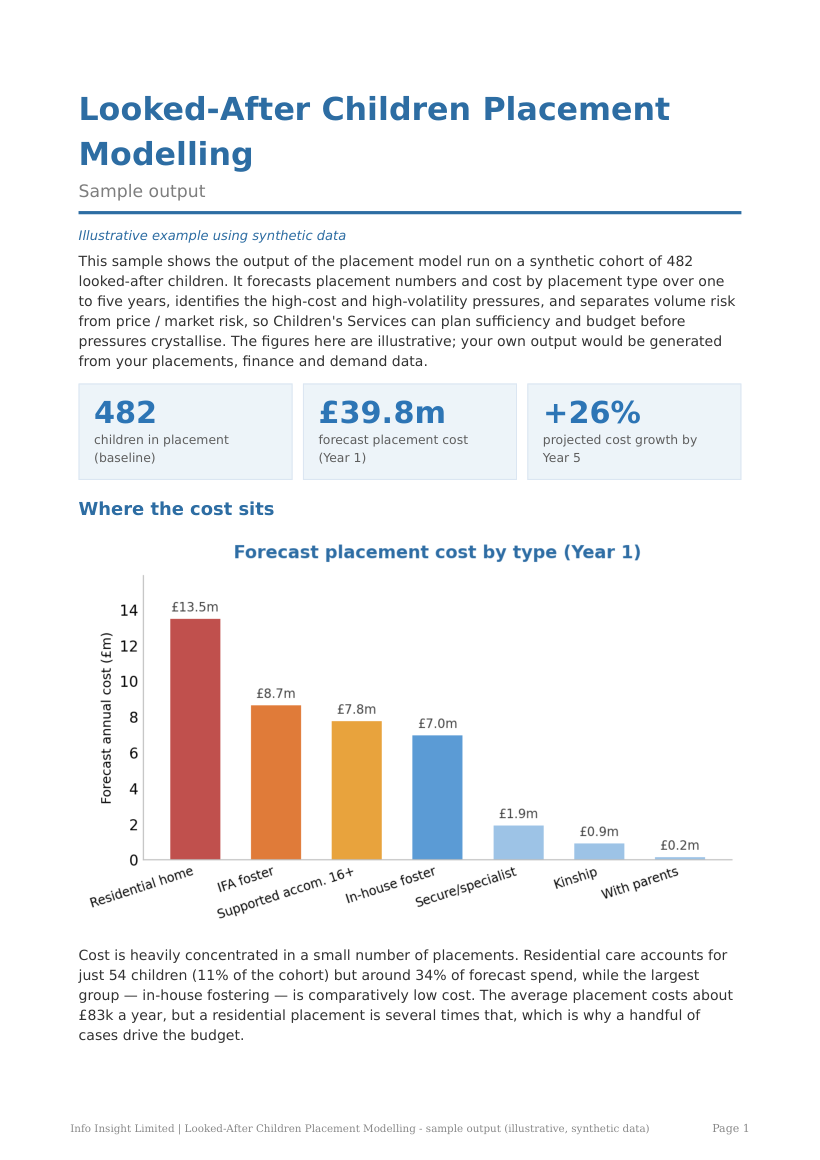
Placement cost is never spread evenly across the cohort. In the sample output, residential care covers 54 children — 11% of the cohort — but around 34% of forecast spend, while the largest single group, in‑house fostering, is comparatively cheap. The average placement costs about £83k a year; a residential placement is several times that.
Forecasting at placement level rather than applying an uplift to last year's outturn is what exposes that concentration, and with it the small number of cases where a commissioning decision moves the budget.
- Forecast cost and numbers for every placement type, not a single total
- Cost share against cohort share, so concentration is visible
- Average and total cost per type, with the spread behind the average
What is actually pushing the cost up
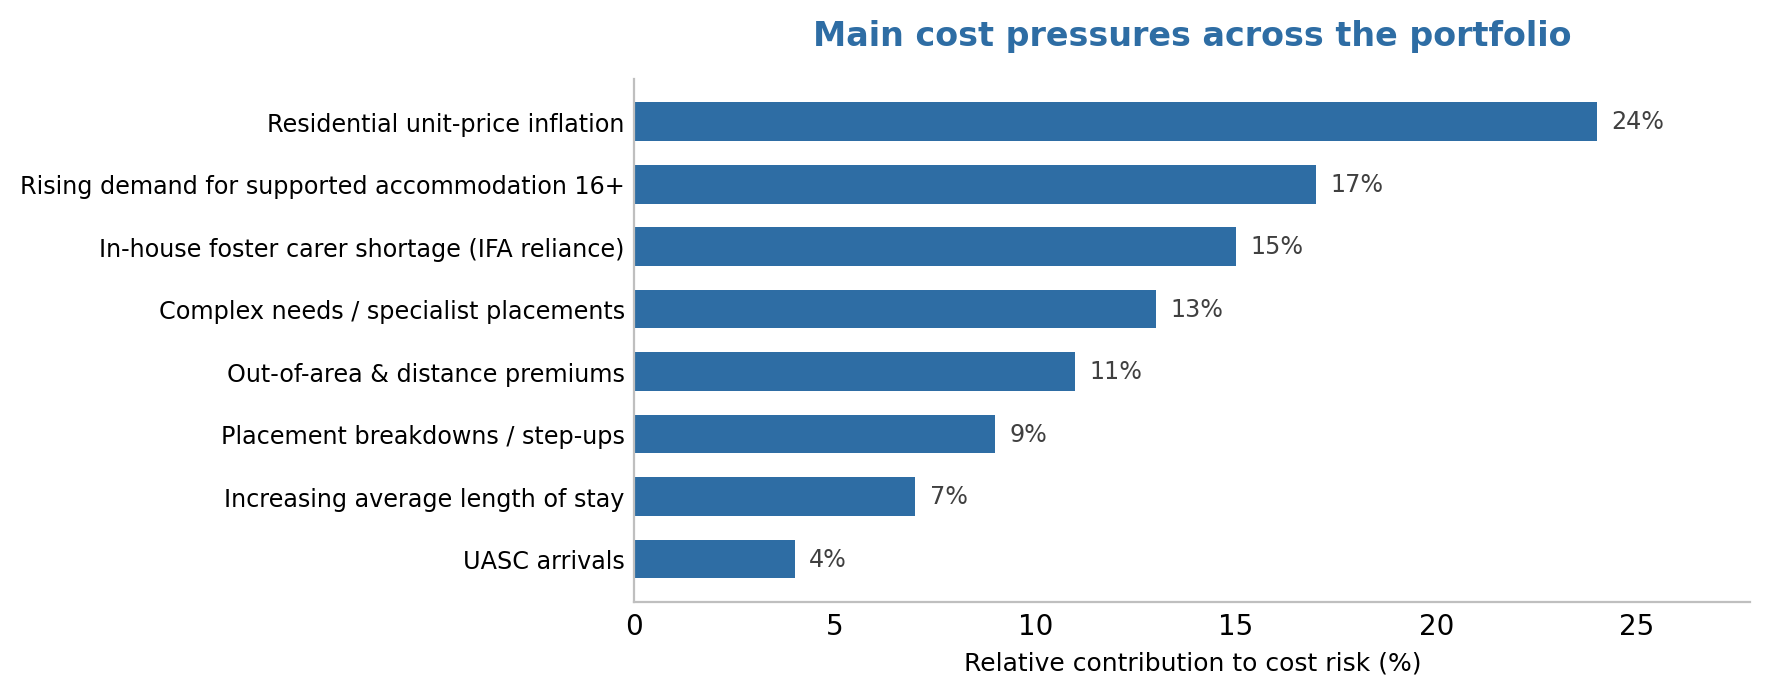
A forecast that returns only a number tells a Section 151 Officer the size of the problem and nothing about the response. The model attributes forecast cost risk across the pressures behind it — unit price inflation, demand growth by placement type, carer supply, complexity, out‑of‑area premiums, placement breakdowns, length of stay and arrivals.
In the sample cohort, residential unit‑price inflation, growing demand for 16+ supported accommodation and a shortage of in‑house foster carers dominate. That points directly at carer recruitment, block‑contract negotiation and in‑area sufficiency, rather than at a general instruction to reduce placement numbers.
- Relative contribution of each pressure to forecast cost risk
- Drivers reported at portfolio level and against each individual placement
- Recalculated as contracts, carer supply and demand change
More children, or the same children costing more?
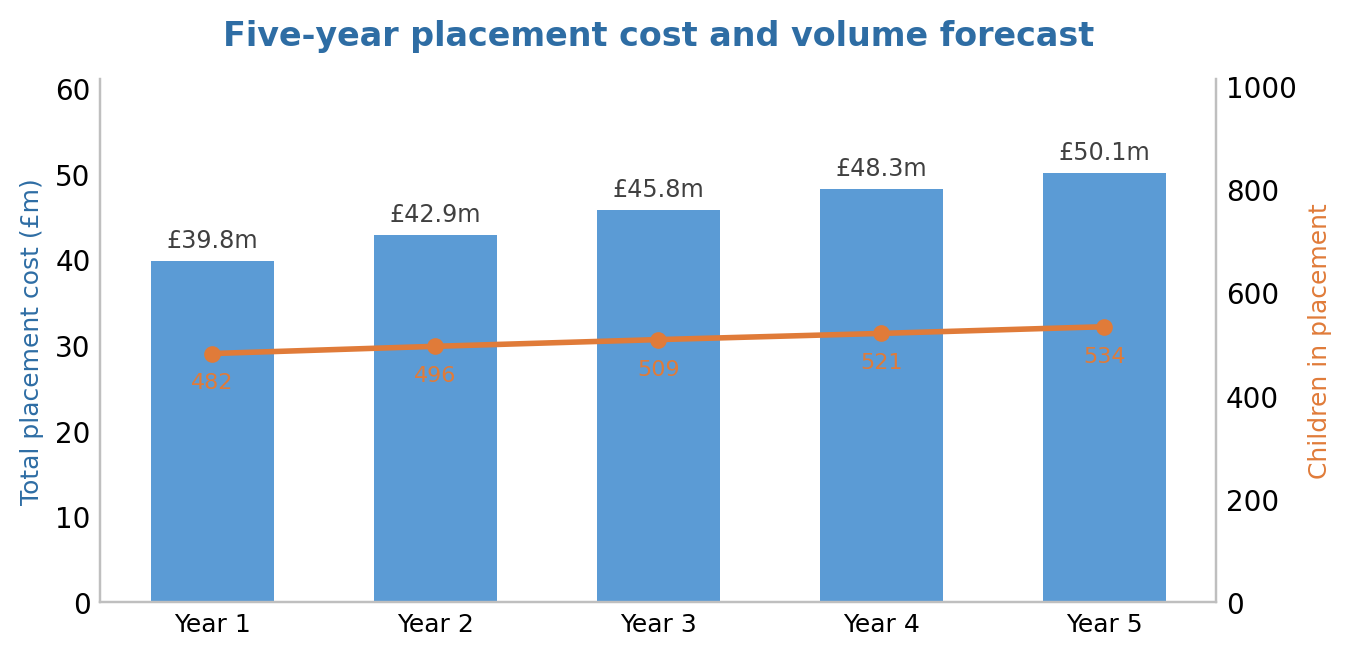
This is the question a placement overspend always turns on, and the one the annual outturn cannot answer. In the sample forecast, total cost rises from £39.8m to £50.1m over five years (+26%) while the number of children in placement grows only from 482 to 534 (+11%).
Decomposed, roughly a third of the increase is volume risk — more children in care — and two thirds is price and market risk: rising unit costs and a mix shifting towards higher‑cost placements. That split is what tells you whether to act on demand, through edge‑of‑care and step‑down work, or on the market, through sufficiency and commissioning.
- Cost and volume projected side by side, year by year
- Growth decomposed into volume and price and market risk
- Scenario runs for carer recruitment, unit price inflation and demand shocks
Down to the individual placement
Alongside the portfolio view, every child in scope is returned with a forecast annual cost, the primary driver behind it and a suggested action — a step‑down to specialist fostering, an in‑area repatriation plan, a stability meeting where breakdown risk is high, an EHCP funding split to review with education, or a move‑on plan for a solo 16+ placement.
The ten placements contributing most to cost and forecast volatility are ranked at the front, so the review effort goes where the money is.
- Forecast annual cost for each placement, with age band and type
- Primary cost driver and a suggested action against each
- The ten highest‑cost, highest‑volatility placements ranked
- Recalibrated as placement, finance and demand data accrue
The placement figures shown in this section come from the sample output, produced on a synthetic cohort of 482 looked‑after children to show the format and type of insight. They are illustrative and should not be read as sector benchmarks.
Which of these is the pressure on your desk this year?
Most engagements start with a single model and a single dataset. Tell us which decision is hardest to defend at the moment and we will scope it honestly.