
Public health and performance
How many people will need a service, and who it will work for
Public health teams commission services against need that is hard to size and outcomes that are hard to explain. These models forecast prevalence in numbers a commissioner can plan against, show what drives a service's success rate, value what prevention saves across NHS and council budgets, and turn the JSNA into a website and report that keep themselves up to date.
Prevalence forecasting
Sizing future need, not just describing the current rate
A prevalence rate tells you how big a problem is today. Commissioning needs to know how many people a programme will have to reach over the next five years.
Childhood excess weight forecasting
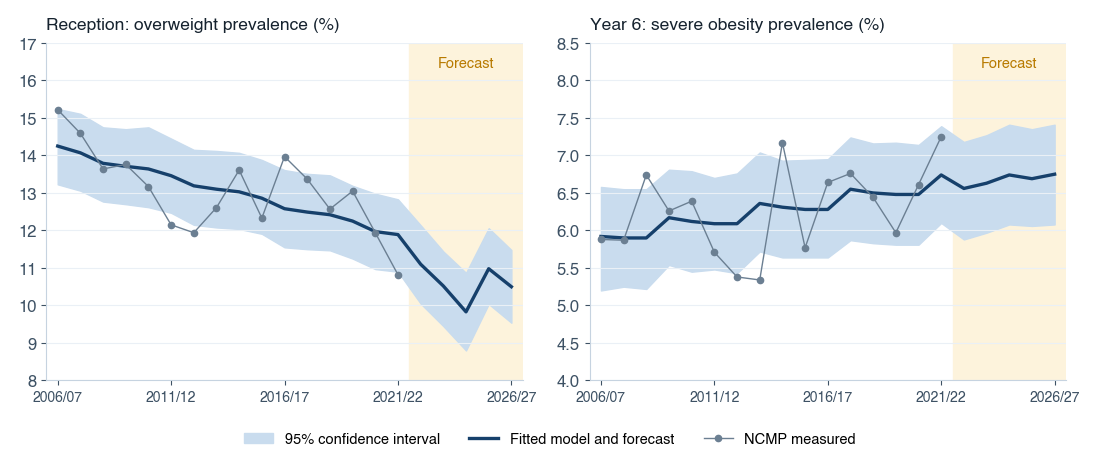
Built for a London borough as the first of three models to shape its commissioning of child weight management programmes. Sixteen years of National Child Measurement Programme data were forecast five years ahead for Reception and Year 6, separately for overweight, obesity and severe obesity.
Several time‑series methods were competed for each indicator — Auto‑ARIMA, Prophet, and linear and exponential trends — and the best fit to the historical data kept. The forecast rates were then applied to GLA population projections, with the year groups in between interpolated, to give the number of children in each weight category in every academic year.
The charts show why this matters. The two ends of primary school are moving in opposite directions: overweight in Reception has been falling steadily, while severe obesity by Year 6 continues to creep up.
- Forecast prevalence with 95% confidence intervals, by school year and weight category
- Numbers of children affected each year, ready for a commissioning plan
- Non‑overlapping categories, so the counts add up
- The basis for estimating how many completed interventions are needed to shift prevalence
Return on investment
Prevention saves money, but not always for the budget that pays
A weight management or physical activity programme is usually funded from the public health grant, yet most of what it saves lands in NHS budgets and some in adult social care. These models value the costs avoided in each budget separately, and say how likely the saving is.
One programme, two budgets, very different returns
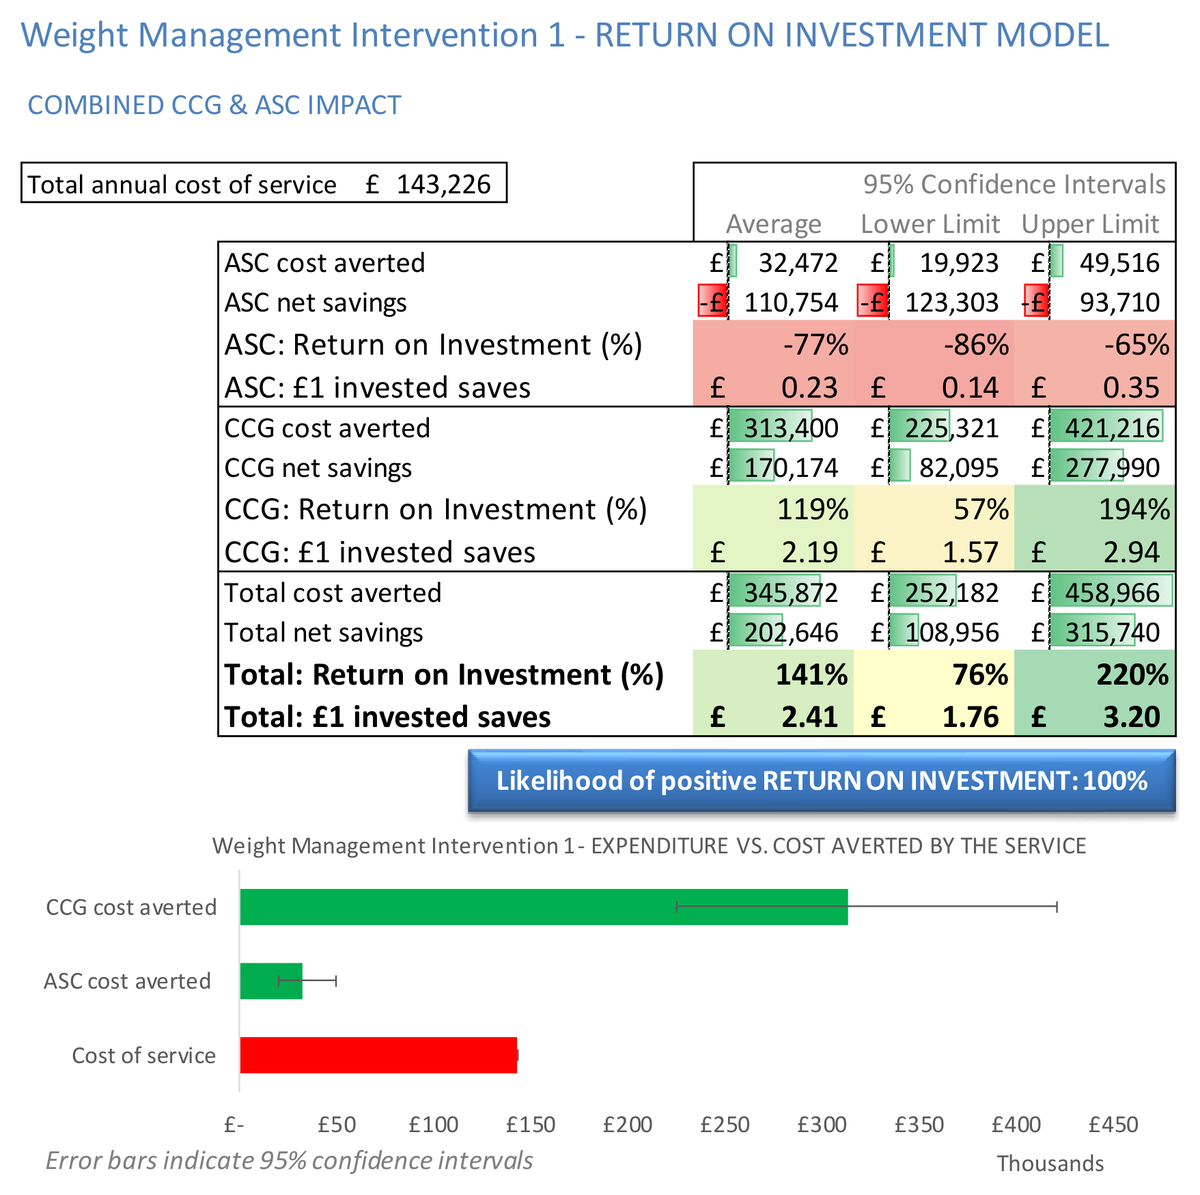
For a weight management programme costing £143,000 a year, the model simulated 1,000 scenarios of the NHS and social care costs it would avoid. Across both budgets it returned £2.41 for every £1 spent (95% CI £1.76 to £3.20), and all 1,000 scenarios showed a positive return.
Split by budget, the picture changes. NHS costs avoided averaged £313,000, or £2.19 per £1. Adult social care costs avoided averaged £32,000, just 23p per £1. Counting only the social care saving, the programme looks like a loss. Counted across the system, it more than pays for itself, and that is the evidence a joint commissioning case or pooled budget needs.
- Costs avoided and net saving for the NHS, adult social care and in total
- Return per £1 invested, with 95% confidence intervals
- Likelihood of a positive return
- How long before savings start, and how long they last
How sure, not just how much
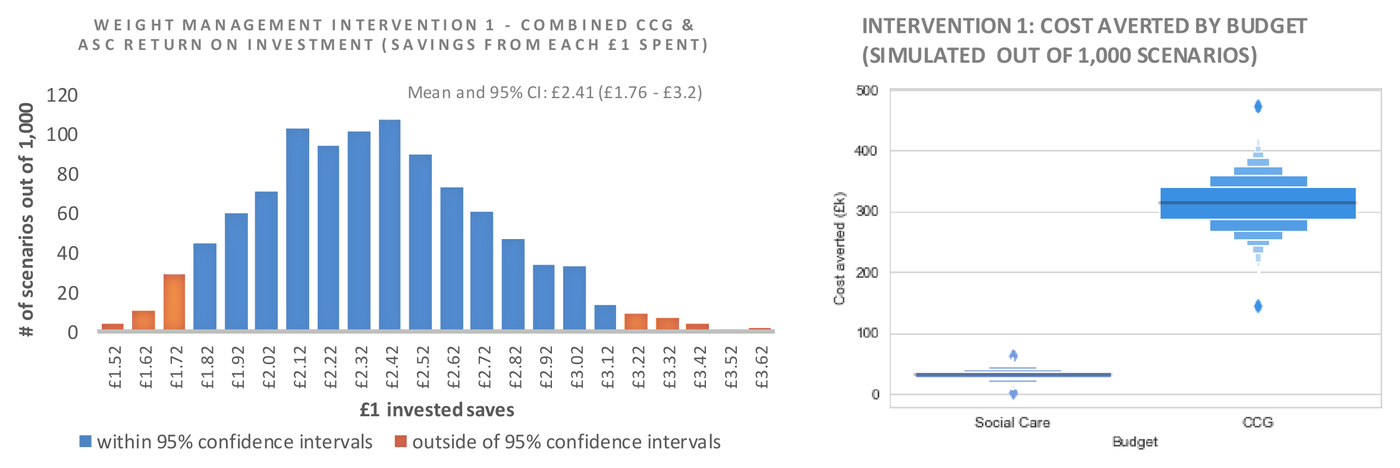
A single ROI figure invites the obvious question: how confident are you? Each uncertain input is given a plausible range rather than one value, and the model is run 1,000 times. The result is a distribution of returns that a finance director can weigh against other calls on the budget.
The chart on the left shows the spread of the return per £1 across every scenario. The chart on the right shows why the social care case is weak on its own: social care savings sit in a narrow band well under £100,000, while NHS savings centre on around £300,000.
- The expected direct saving to health and social care budgets
- The likelihood of losing or saving money on a given intervention
- How variation in baseline cost changes the return
- Competing interventions compared on the same basis
For five prevention programmes compared against adult social care costs alone, see prevention and early intervention in social care
Service outcome modelling
What predicts success, from the first contact
Most services record far more about their clients than they ever analyse. Used properly, the data taken at the first appointment can show who is likely to succeed and what the service can change.
Stop smoking service: who quits at four weeks
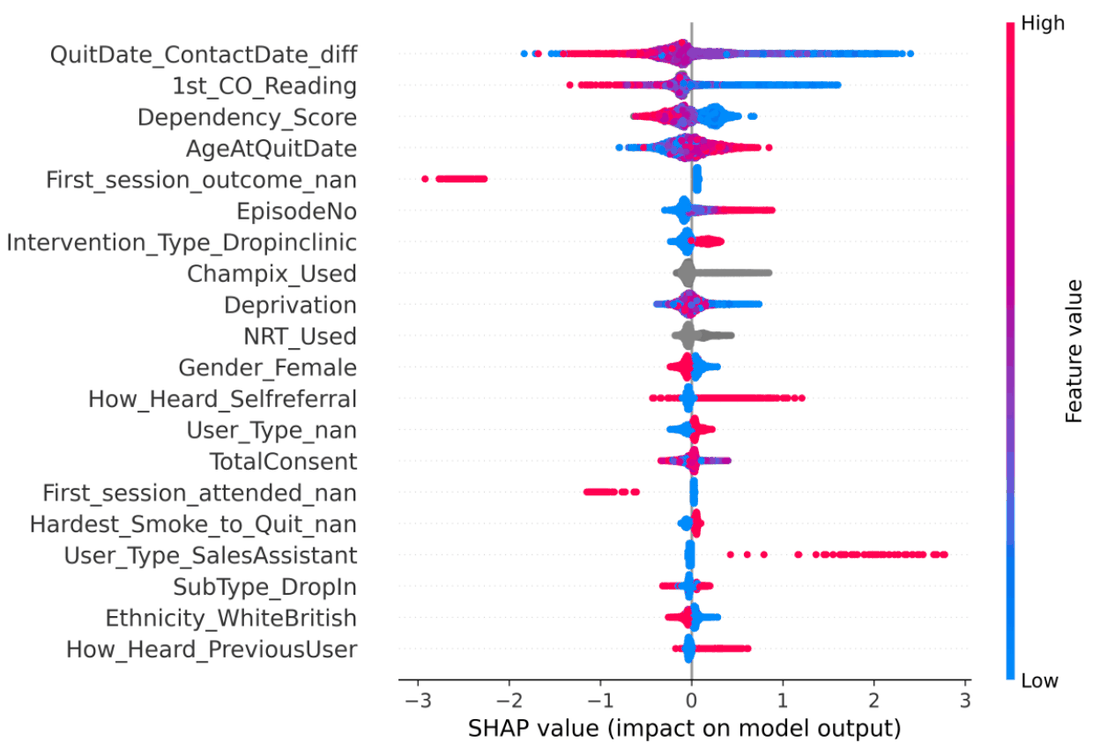
Five years of client records, 5,835 people, from a stop smoking service covering two London boroughs. The question was whether the information collected in the first days of contact could predict a confirmed quit at four weeks.
A logistic regression measured how much each factor changes the odds of quitting. A gradient‑boosted tree model tested how well quitting can be predicted for new clients: on a held‑out 20% of records it reached an AUC of 0.76, with 72% of predicted quitters going on to quit. That is useful for targeting rather than definitive, and it is reported as such.
Some findings are directly actionable. Every day's delay between first contact and setting a quit date reduced the odds of quitting by about 1%. A low initial carbon monoxide reading roughly doubled them, and clients with a recorded mental illness were less likely to quit.
- Fields recorded later in the programme removed, so the model cannot predict the outcome from the outcome
- Odds ratios with confidence intervals for demographic, health and service factors
- Client‑level explanations of each prediction
- Differences between referral routes, settings and delivery models identified for service managers
Reporting and insight
Performance reporting that writes itself
Producing the analysis is one job. Writing it up every quarter is another, and it is where most analytical capacity in a council actually goes.
JSNA performance reporting
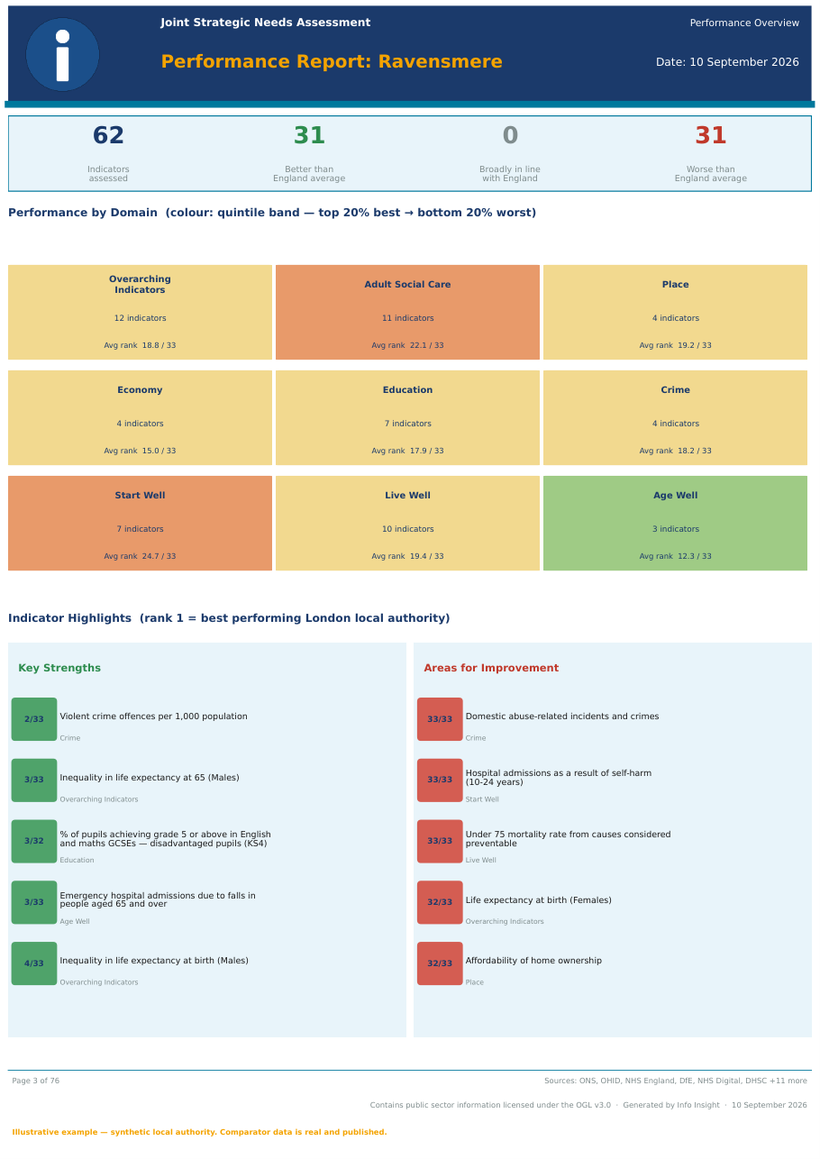
Automated Joint Strategic Needs Assessment reporting, refreshed directly from OHID Fingertips, ONS and GLA indicator sources. Indicators are benchmarked against England and against London or regional peers, scored into quintile bands, and grouped into domains — then written up as a narrative executive summary.
- Automated data refresh from published national indicator sources
- At‑a‑glance comparison against England and regional peers
- Domain‑level scoring with key strengths and areas for improvement
- Delivered as a formatted report, or as an interactive JSNA website
- Data vintage stated on every indicator, so age of evidence is visible
The JSNA as a website that keeps itself up to date
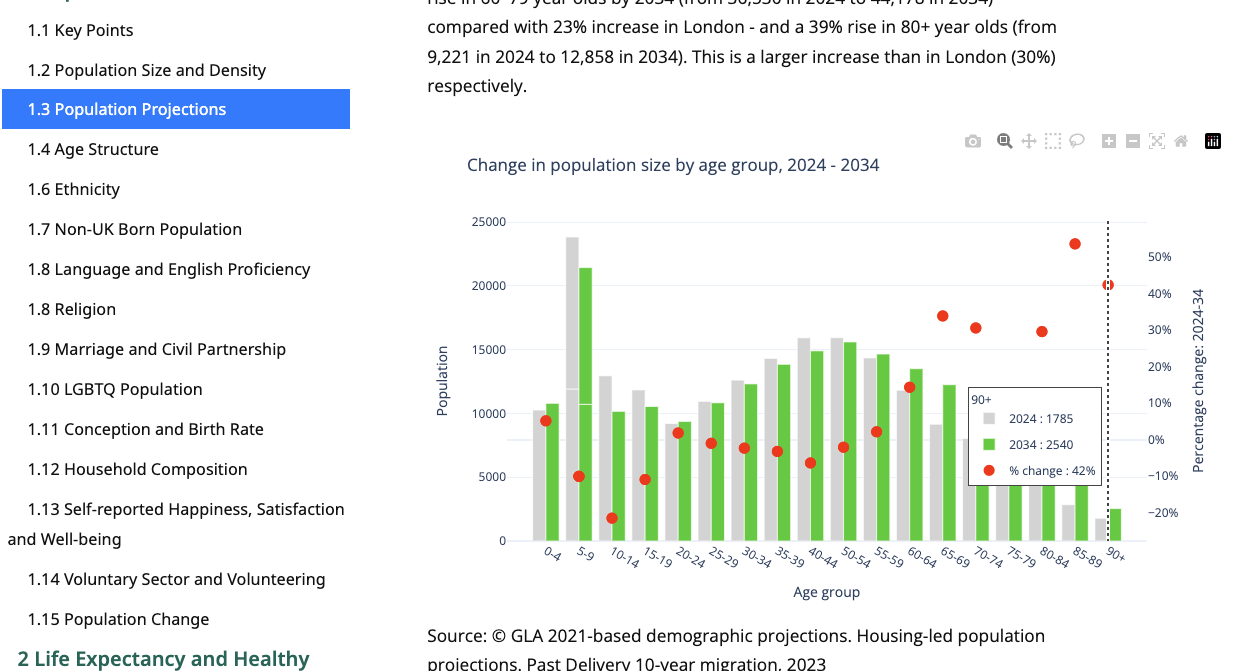
Most JSNAs are still published as long PDF chapters that date quickly and are hard to search. We rebuild the JSNA narrative as an interactive website, organised topic by topic — population, life expectancy, mortality, education and employment, vulnerable groups — with every chart connected to its published source: OHID public health profiles, ONS and GLA population projections.
The written interpretation is generated from the same data as the charts. When a new release comes out the site refreshes, and the sentences comparing the borough with London and England are rewritten to match, so the text never lags behind the numbers.
- Contents that follow the JSNA structure, from key points down to single indicators
- Interactive charts: hover for values, zoom, save as an image
- Narrative generated from the latest data, not retyped at each refresh
- Source and period stated under every chart
Comparison and uncertainty on every chart
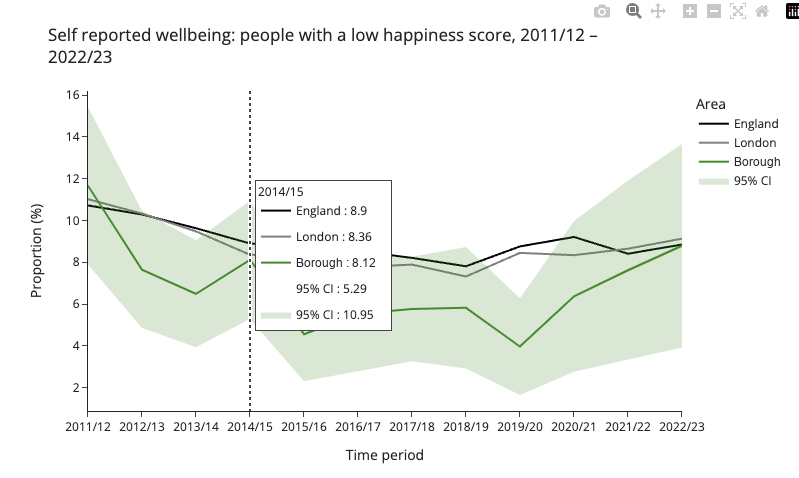
Each indicator is plotted against London and England over time, with the borough's confidence interval shaded, so a reader can see whether a gap from England is a real difference or within the margin of error.
A summary dashboard sits above the topic pages. For every JSNA indicator it shows the latest value, the borough's rank, the change since the previous period and the comparison with England, the region and statistical neighbours: the at‑a‑glance view a health and wellbeing board needs.
Web pages are also far easier to make accessible than PDFs, which matters under the public sector accessibility regulations. The site is built with open‑source tools, so there is no software licence to renew, and the code is handed over.
AI‑driven insight from local authority data
Advanced AI applied to social care, finance and public health data to identify key risks, pressures and opportunities across complex financial and operational datasets — returning a clear written narrative rather than another dashboard to interpret.
- Clear, accessible insight in plain English
- Early identification of financial and service‑delivery risks
- Recommended actions, prioritised and attributed to the data behind them
- Substantially less time spent on manual analysis and routine performance reporting
Commissioning a service you cannot yet size?
Tell us the programme and the data you hold, whether that is published indicators or your own service records. We will tell you what can be forecast or predicted from it, and how reliably.