Sample outputs

Worked examples, not brochures

Each of these is a real output from a real model, produced on synthetic or published data so it can be shared openly. They show the format, the level of detail and the type of insight you would receive — generated from your own data.

About these examples The housing models are demonstrated on a synthetic portfolio of 4,200 homes, and the placement model on a synthetic cohort of 482 looked‑after children. The temporary accommodation, JSNA, childhood obesity, long‑term care and MTFS reports use the London Borough of Ravensmere, a borough that does not exist — its figures are constructed, while the comparator authorities and England lines are real published data. The MTFS forecast has no comparators, so every figure in it is constructed. No client data appears in these downloads, and the figures shown should not be read as sector benchmarks. Examples from client work on the service pages are anonymised and show aggregate results only.

Data sources: OHID Fingertips, the Office for National Statistics, NHS England, the Department for Education, the Department of Health and Social Care, HM Treasury, MHCLG statutory homelessness releases, the National Child Measurement Programme and other public sector bodies, each credited in the report that uses it. Contains public sector information licensed under the Open Government Licence v3.0. © Crown copyright and database right 2026. Info Insight Limited is an independent supplier; these analyses are not produced, endorsed or approved by any of the bodies named.

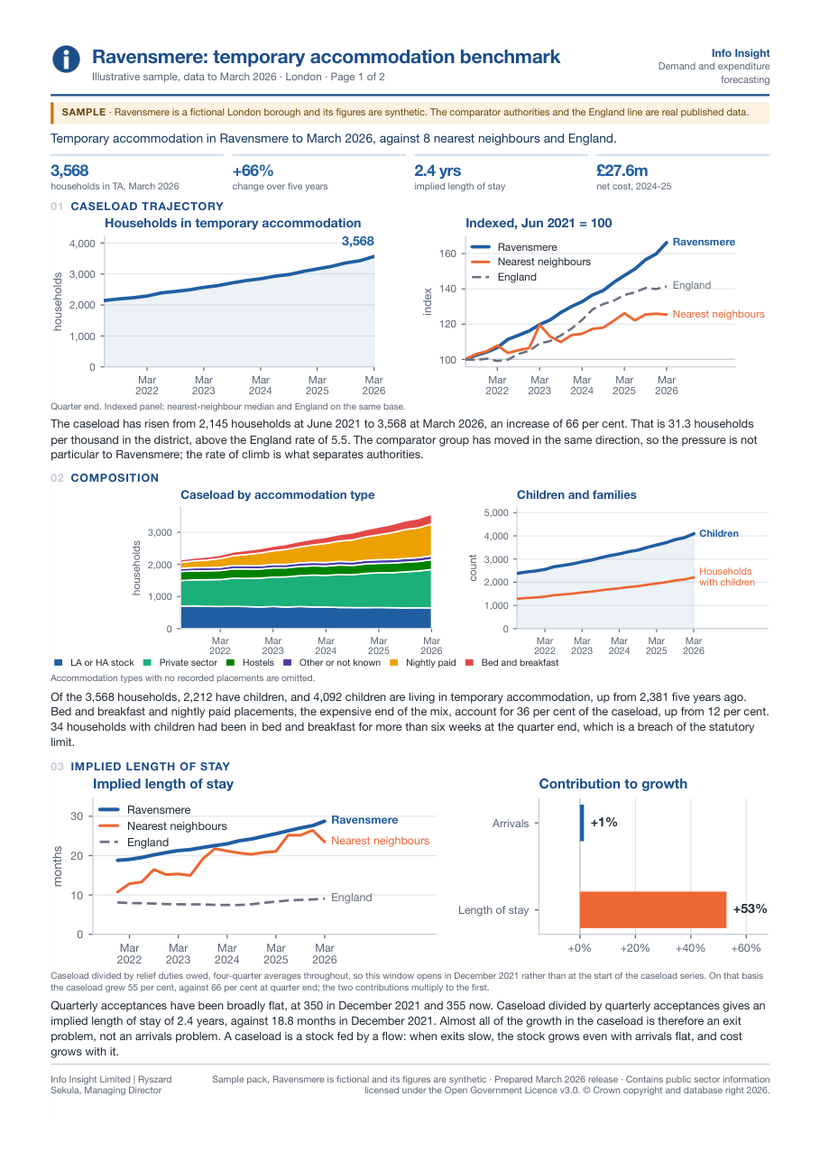
Page one of the Ravensmere temporary accommodation benchmark, showing caseload trajectory, composition by accommodation type, implied length of stay and the split of growth between arrivals and length of stay.

Temporary accommodation benchmark

  • Housing
  • Synthetic authority, real comparators
  • 2 pages
  • PDF

A two‑page benchmark of temporary accommodation caseload, cost and length of stay, set against eight nearest statistical neighbours and England. The subject is the same synthetic borough used in the JSNA sample; the comparator authorities and the England line are real published data.

The analysis decomposes caseload growth into its two possible causes. In this example, arrivals contributed +1% while length of stay contributed +53% — the growth is an exit problem, not an arrivals problem. That distinction changes the whole response, and it is invisible in the headline number.

  • Caseload trajectory, indexed against comparators
  • Composition by accommodation type, including nightly‑paid and bed and breakfast exposure
  • Implied length of stay against nearest neighbours and England
  • Growth decomposed into arrivals and length of stay
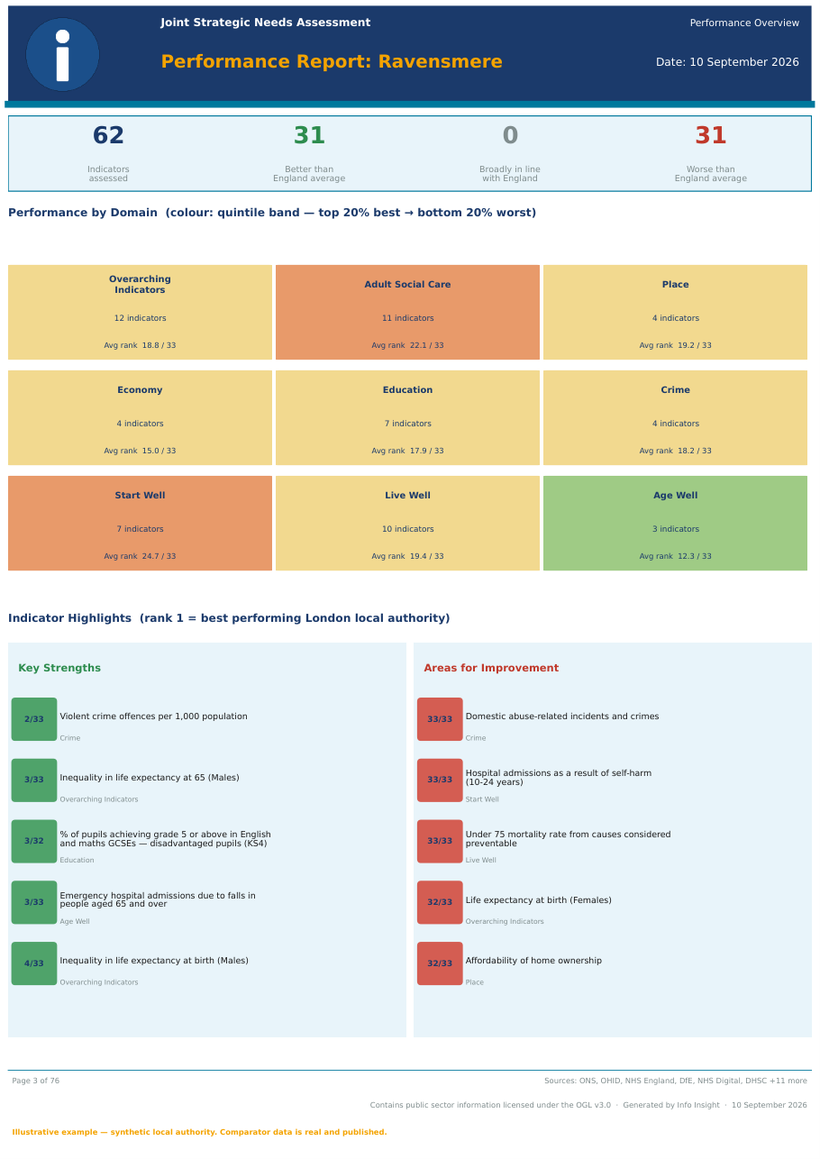
Performance overview page from the Ravensmere Joint Strategic Needs Assessment report, showing 62 indicators assessed, average rank for each of nine domains, and ranked key strengths and areas for improvement.

JSNA performance report

  • Public health
  • Synthetic authority, real comparators
  • 76 pages
  • PDF

A full Joint Strategic Needs Assessment performance report, generated automatically from published indicator sources and written up as a narrative rather than a data dump.

The subject of this sample, the London Borough of Ravensmere, is a synthetic local authority — so the report can be shared openly without publishing a real borough’s performance. The 32 comparator authorities it is ranked against are real, and their figures are as published.

Sixty‑two indicators are benchmarked against England and against the 33 London authorities, scored into quintile bands and grouped into nine domains. The executive summary is written by AI from the underlying results, so the narrative and the numbers cannot drift apart.

  • Automated refresh from OHID Fingertips, ONS and GLA sources
  • Comparison against England and regional peers, with quintile banding
  • Domain‑level average ranks and indicator‑level highlights
  • Data vintage reported for every indicator
  • Available as an interactive JSNA website as well as a report
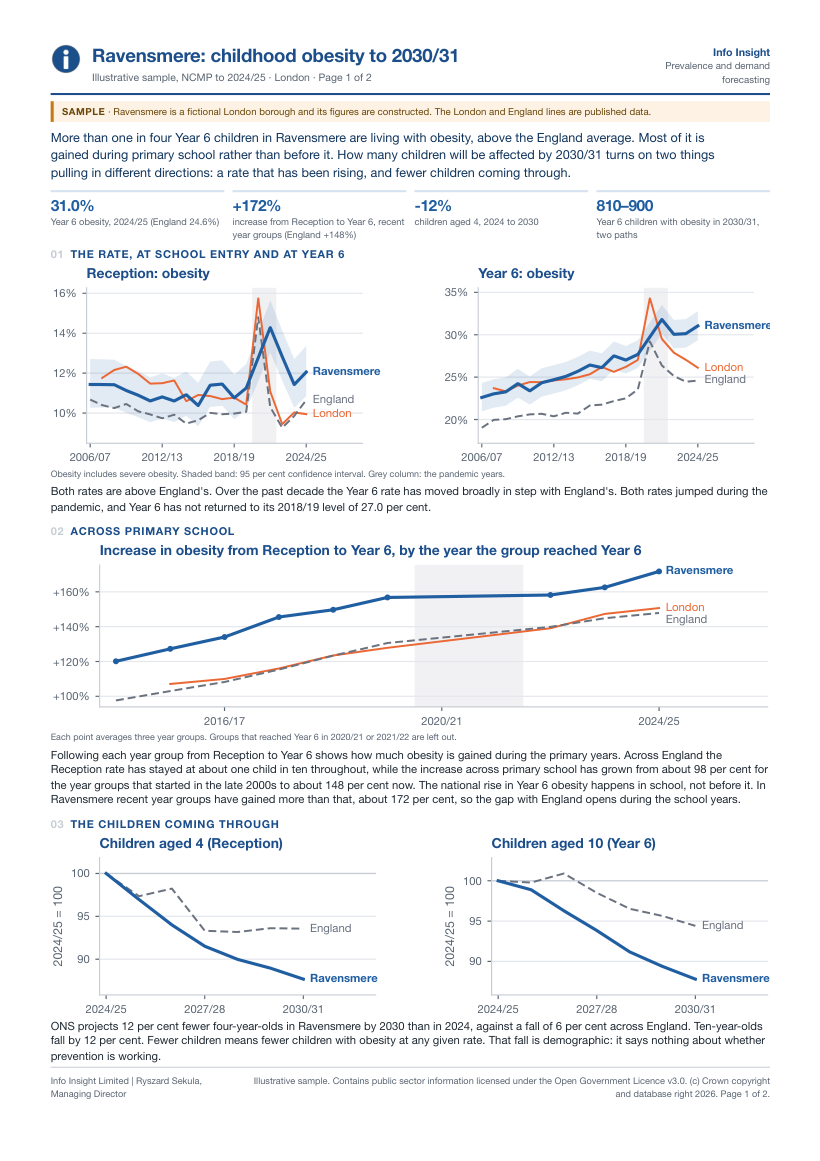
Page one of the Ravensmere childhood obesity sample, showing headline figures of 31.0 per cent Year 6 obesity, a 172 per cent increase from Reception to Year 6, 12 per cent fewer four-year-olds by 2030 and 810 to 900 Year 6 children with obesity in 2030/31, above charts of obesity rates against London and England, the increase across primary school, and projected numbers of children aged 4 and 10.

Childhood obesity to 2030/31

  • Public health
  • Synthetic authority, real comparators
  • 2 pages
  • PDF

A two‑page view of childhood obesity built from National Child Measurement Programme data to 2024/25 and ONS population projections. It sets the borough against London and England, follows year groups from Reception to Year 6, and projects both the rate and the number of children affected to 2030/31. The subject is the same synthetic borough used in the JSNA and temporary accommodation samples; the London and England lines are real published data.

In this example, 31.0% of Year 6 children are living with obesity, against 24.6% across England, and most of it is gained during primary school rather than before it. By 2030/31 the count lands between 810 and 900 — held down by 12% fewer children coming through, not by any improvement in the rate. Neither today’s count nor today’s rate is a safe planning figure on its own.

  • Reception and Year 6 obesity against London and England, with confidence intervals
  • The increase across primary school, following each year group through
  • Projected cohorts of four‑ and ten‑year‑olds from ONS projections
  • Rates and numbers of children to 2030/31 on two paths, cross‑checked against the year group already in school
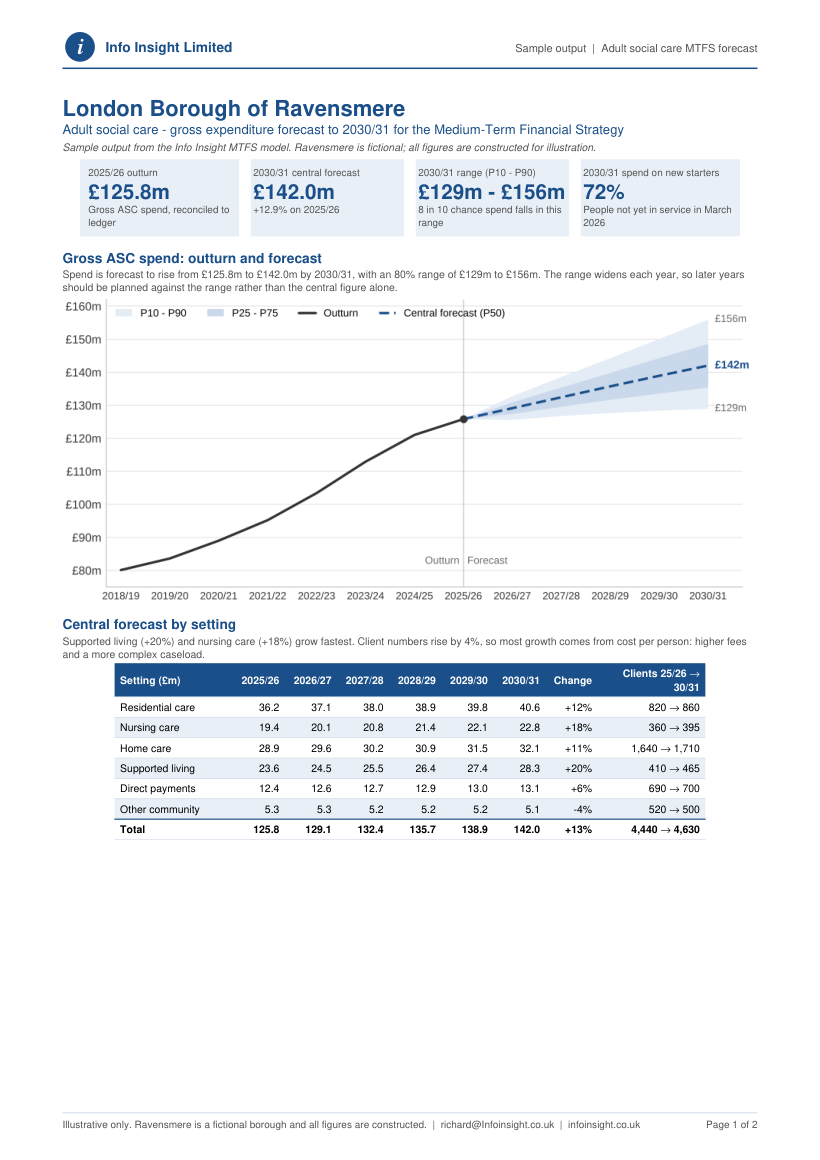
Page one of the Ravensmere adult social care MTFS forecast sample, showing headline figures of 125.8 million pounds outturn in 2025/26, a central forecast of 142.0 million pounds in 2030/31, a range of 129 to 156 million pounds and 72 per cent of 2030/31 spend on new starters, above a fan chart of outturn and forecast spend from 2018/19 to 2030/31 and a table of the central forecast by care setting.

Adult social care forecast for the MTFS

  • Social care
  • Synthetic authority, constructed figures
  • 2 pages
  • PDF

A two‑page summary of a five‑year gross expenditure forecast for adult social care, written for the Medium‑Term Financial Strategy. It forecasts spend and client numbers by care setting to 2030/31 with a range around every year, shows which assumptions move the answer most, and costs Finance’s own scenarios. The subject is the same synthetic borough used in the other Ravensmere samples, and every figure in this one is constructed.

In this example, spend rises from £125.8m to a central £142.0m by 2030/31, with an 80% range of £129m to £156m. Client numbers rise by only 4%, so most of the growth is cost per person. By 2030/31, 72% of spend is on people not yet in service in March 2026 — the forecast rests on new‑starter assumptions, not the current caseload. A one‑point fee uplift on residential and nursing care is worth £3.2m a year by the end of the period.

  • Outturn and forecast to 2030/31 with P10–P90 and P25–P75 ranges
  • Central forecast and client numbers by care setting
  • Spend split between today’s clients and new starters, and which assumptions matter most
  • Upside, downside, stress and policy scenarios, with £ per 1% change
  • A backtest against actual outturn, and a base year reconciled to the ledger
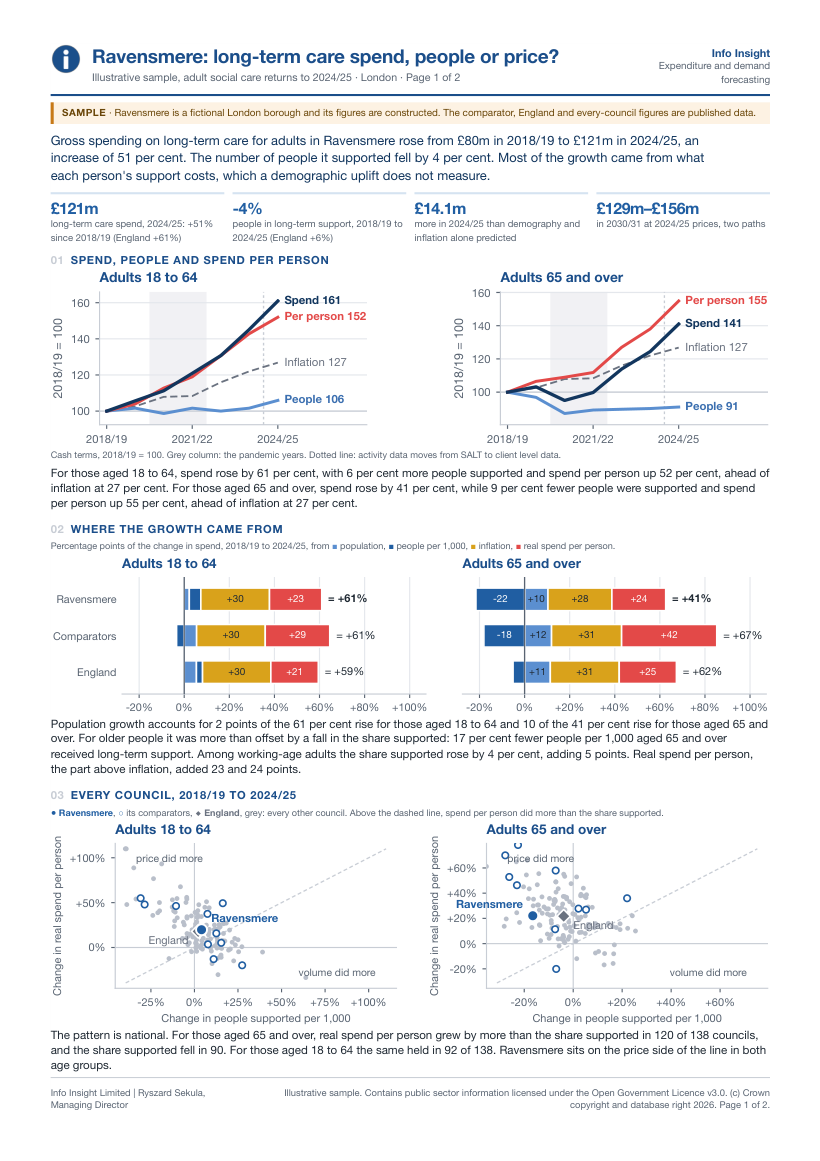
Page one of the Ravensmere long-term care sample, showing headline figures of 121 million pounds long-term care spend in 2024/25, a 4 per cent fall in people in long-term support, 14.1 million pounds more than demography and inflation predicted and 129 to 156 million pounds in 2030/31, above charts of spend, people and spend per person indexed to 2018/19, the change in spend split into population, people per 1,000, inflation and real spend per person, and every council in England plotted by volume and price.

Long‑term care spend: people or price?

  • Social care
  • Synthetic authority, real comparators
  • 2 pages
  • PDF

A two‑page benchmark of adult long‑term care spend built from the Adult Social Care Finance Return and long‑term support activity data to 2024/25. It splits the change in spend since 2018/19 into population, the share of people supported, inflation and real spend per person, for adults aged 18 to 64 and 65 and over, against ten nearest London neighbours, England and every other council. The subject is the same synthetic borough used in the other Ravensmere samples; the comparator, England and every‑council figures are real published data.

In this example, spend rose by 51% to £121m while the number of people supported fell by 4%, and 2024/25 came in £14.1m above what demography and inflation alone predicted. For older people the uplift landed close, but only because fewer people supported cancelled out a rising real cost per person. To 2030/31, demography alone gives about £129m and the recent pace of real spend per person about £156m — the £27m between them is what a demographic uplift does not see.

  • Spend, people supported and spend per person indexed against inflation, by age group
  • The change in spend decomposed into volume and price, against comparators and England
  • Every council in England plotted by change in people supported and real spend per person
  • Two paths to 2030/31 in 2024/25 prices, with what a fuller record‑level model would add
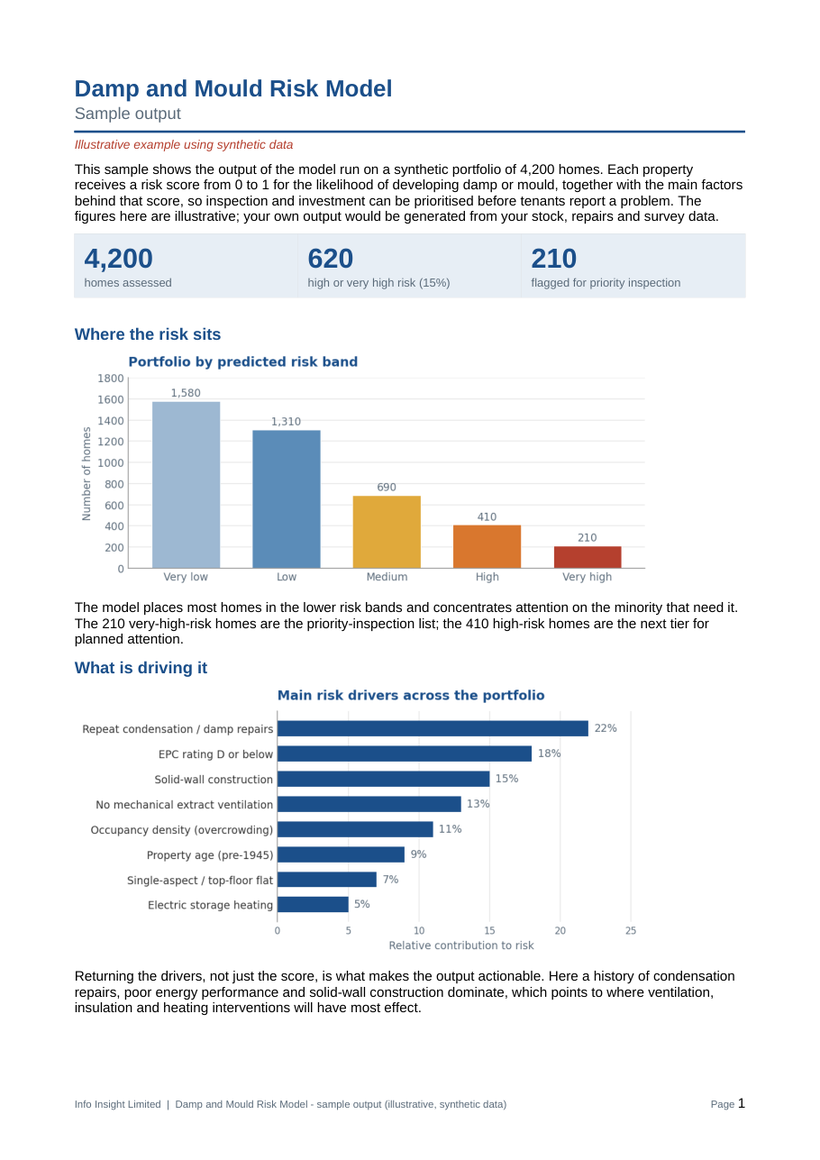
First page of the damp and mould risk model sample output, showing headline counts and the portfolio risk band distribution.

Damp and mould risk model

  • Housing
  • Synthetic data, 4,200 homes
  • 2 pages
  • PDF

The output of the damp and mould risk model run on a synthetic portfolio. Each property receives a risk score from 0 to 1, together with the main factors behind that score, so inspection and investment can be prioritised before tenants report a problem.

In this example, 620 homes fall into the high or very high bands and 210 are flagged for priority inspection. Repeat condensation repairs, poor energy performance and solid‑wall construction dominate the portfolio drivers — which points directly at ventilation, insulation and heating.

  • Portfolio distribution across five risk bands
  • Relative contribution of each risk driver across the stock
  • The ten highest‑scoring homes, with primary driver and suggested action
  • A note on how to read the scores and how they are recalibrated
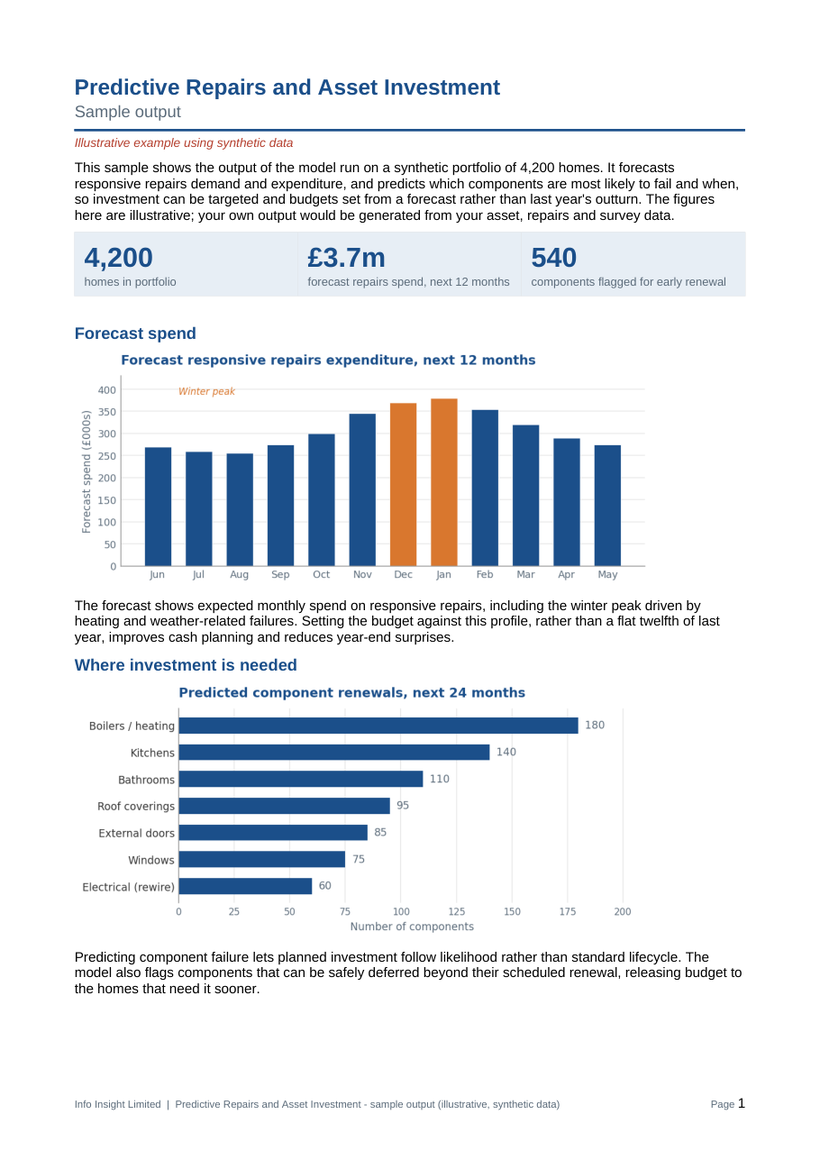
First page of the predictive repairs and asset investment sample output, showing forecast spend by month and predicted component renewals.

Predictive repairs and asset investment

  • Housing
  • Synthetic data, 4,200 homes
  • 2 pages
  • PDF

The output of the repairs and asset forecasting model on the same synthetic portfolio. It forecasts responsive repairs demand and expenditure month by month, and predicts which components are most likely to fail and when.

The example forecasts £3.7m of responsive repairs over twelve months, with a clear winter peak, and flags 540 components for early renewal. Budgets set against that profile rather than a flat twelfth of last year's outturn behave very differently at year end.

  • Monthly forecast of responsive repairs expenditure
  • Predicted component renewals over 24 months, by component type
  • The ten components most in need of attention, with failure window and cost
  • Suggested action for each, including safe deferrals
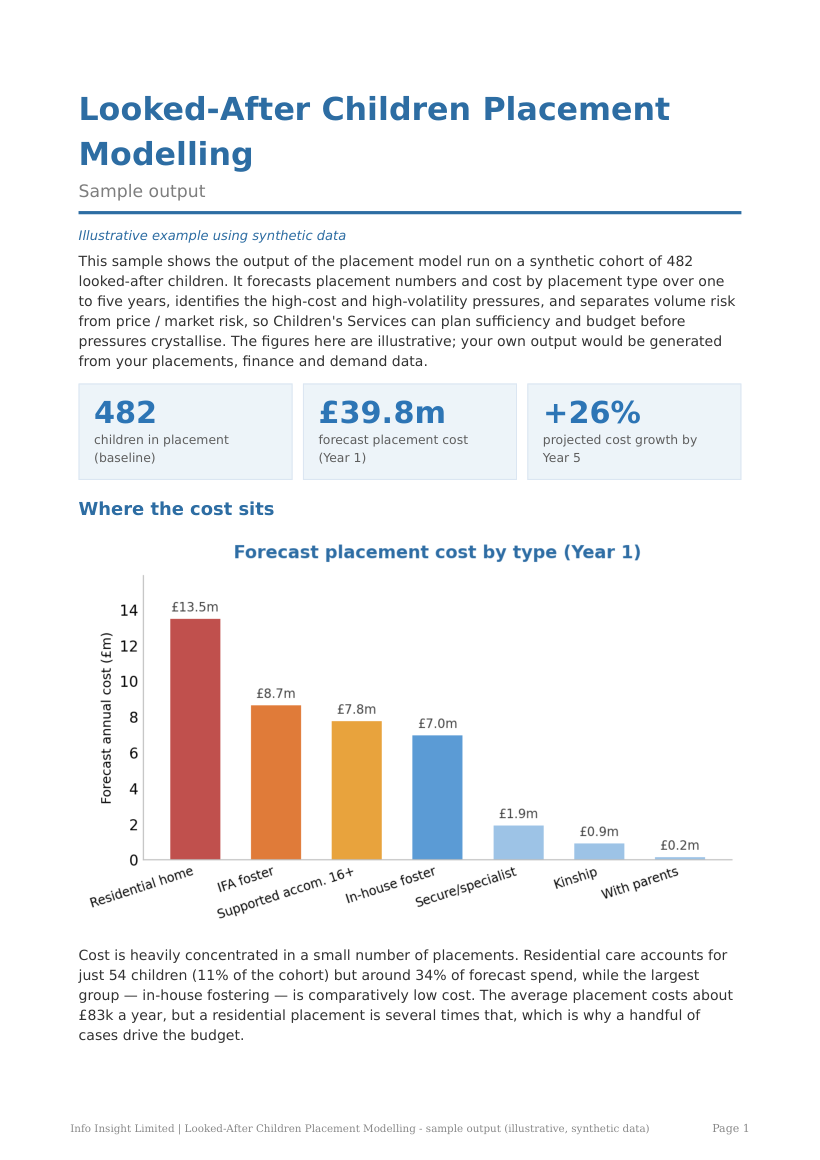
First page of the looked-after children placement modelling sample output, showing headline figures of 482 children in placement, 39.8 million pounds forecast cost in year one and 26 per cent projected growth by year five, above the forecast cost by placement type chart.

Looked‑after children placement modelling

  • Social care
  • Synthetic cohort, 482 children
  • 3 pages
  • PDF

The output of the placement model run on a synthetic cohort of looked‑after children. It forecasts placement numbers and cost by placement type over one to five years, attributes the cost risk to the pressures behind it, and separates volume risk from price and market risk.

In this example, cost rises from £39.8m to £50.1m over five years (+26%) while the cohort grows only from 482 to 534 (+11%) — about a third volume and two thirds price and market. Residential care accounts for 11% of the children and around 34% of the spend, which is why a handful of cases sets the budget.

  • Forecast cost and numbers by placement type
  • Relative contribution of each cost pressure across the portfolio
  • Five‑year cost and volume forecast, decomposed into volume and price risk
  • The ten highest‑cost, highest‑volatility placements, with primary driver and suggested action

Model performance

Stated openly, including where it is weak

A model that is not honest about its limits is not usable for public money. Performance is reported on held‑out test data and reported in full.

0.92AUC, long‑term social care need classifier
84%Accuracy on held‑out test data
<1%Typical variance of 12‑month ASC expenditure forecasts
5 yearsForward horizon for dedicated forecasting models

Want to see the same output built from your data?

The fastest way to judge whether a model is worth commissioning is to see it run on data you recognise. Get in touch and we will scope a first build.